Observability pipelines are hard to test because the interesting data only appears in production. These fixtures reproduce it on disk. Traces ship as OTLP JSON and in the Jaeger and Zipkin shapes, with the same span tree across formats so a converter can be scored. Metrics come as Prometheus exposition text and OTLP metric documents covering counters, gauges, histograms, and exemplars. Logs arrive as structured JSON Lines and plain text with documented severity mixes, stack traces, multi-line records, and deliberately truncated tails. Dashboards, recording and alerting rules, collector configuration, and alert-webhook payloads complete the set. Timestamps, trace IDs, and span IDs are fixed, so two runs of your parser produce identical output.
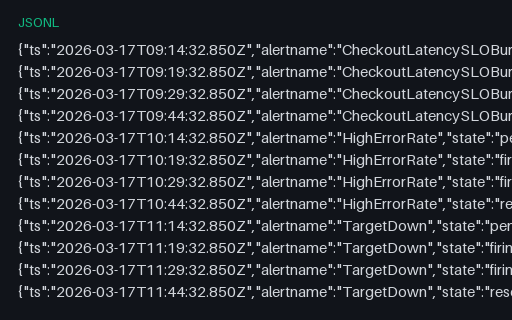
Sixteen state transitions across four alerts, each moving inactive to pending to firing to resolved with the previous state recorded. The pending stage is where a for: duration is being served and no notification is sent, which is what makes alert-noise analysis possible.
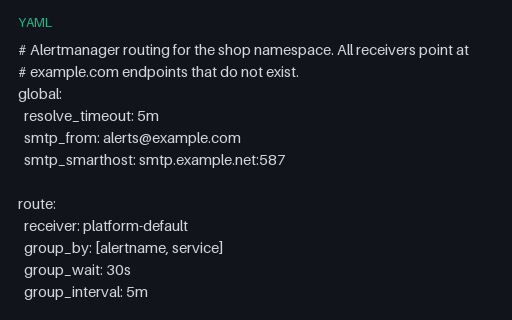
An Alertmanager configuration with the routing behaviour that is hard to reason about without a fixture: a continue: true branch so a critical alert reaches two receivers, an inhibition rule suppressing warnings under a matching critical, and a weekend mute window.
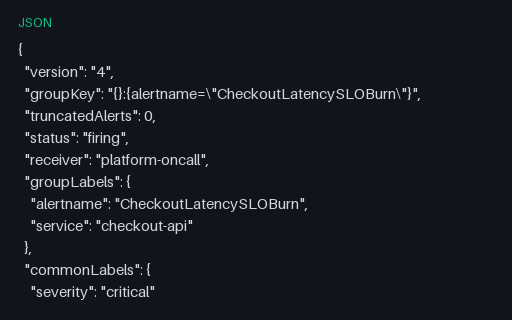
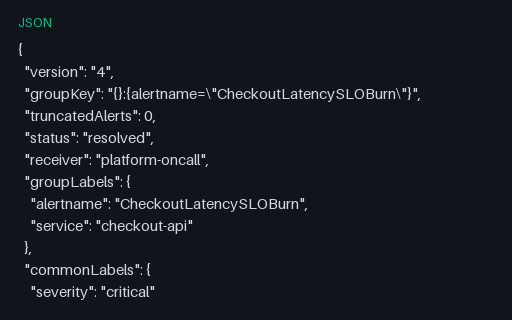
The JSON body Alertmanager POSTs to a webhook when an alert fires, including the detail that catches everyone: endsAt is Go's zero time rather than null or absent, so a receiver that parses it as a real timestamp records an alert that ended in the year 1.
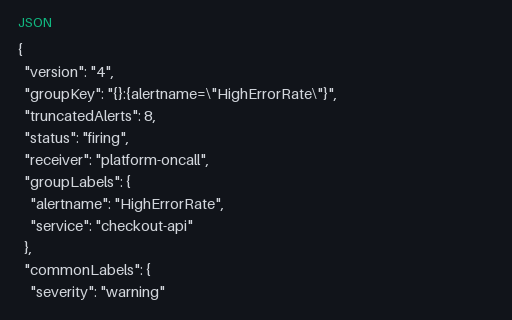
One notification carrying twelve grouped alerts with truncatedAlerts set to 8, meaning twenty were firing. Receivers that count the alerts array report a smaller incident than actually exists — the field is there precisely so that does not have to happen.
The resolved notification for the same alert half an hour later, carrying an identical fingerprint and group key with endsAt now populated. Paired with the firing payload so incident-tracking code can be tested for correctly closing the incident it opened.
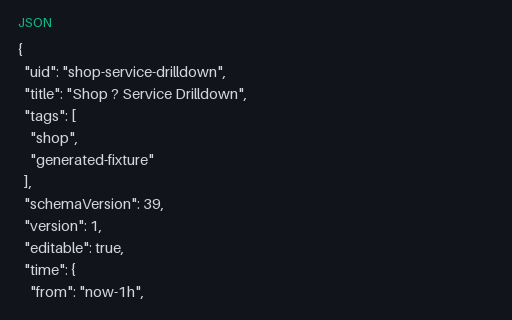
A dashboard driven by four template variables, one of which queries using the value of another — the chained dependency that must be resolved in order. Multi-select variables interpolate as regex alternations, which is why every query here uses =~ rather than =.
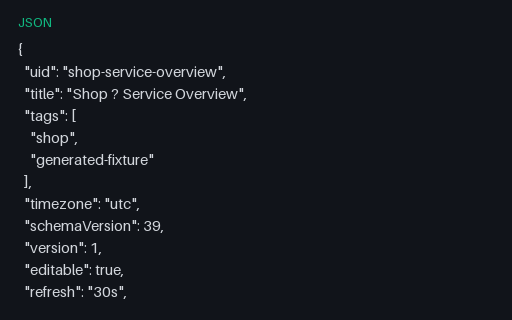
A dashboard document in the Grafana JSON model: five panels on the 24-column grid, each with a datasource reference by UID, a PromQL target and a unit. Three panels query the recording rules in this category, so the dashboard and the rule file can be validated against each other.
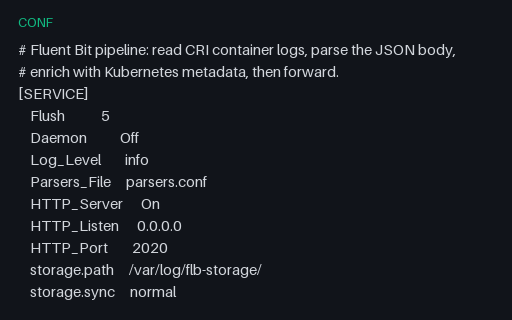
A Fluent Bit configuration in its INI-like section format: a tail input using the CRI multiline parser that reassembles the partial-line fixture, Kubernetes enrichment, a modify filter dropping two of the high-cardinality fields, and a throttle. Keys are space-aligned, not delimited.
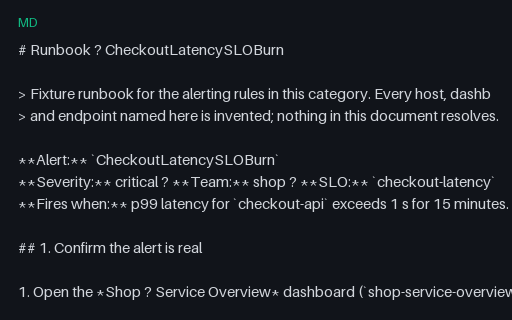
The runbook the alerting rules link to, written as a real one would be: confirm, localise, mitigate, close out, with a symptom table pointing at the trace and profile fixtures in this category. A realistic document for testing runbook linting, link checking and documentation pipelines.
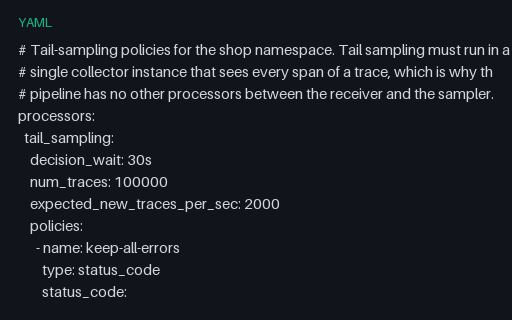
Six tail-sampling policies including an inverted regex match that drops health checks and a composite policy with its own rate limit and ordered sub-policies. Policies are OR-ed and one match keeps the entire trace, which is the semantic most people get backwards.
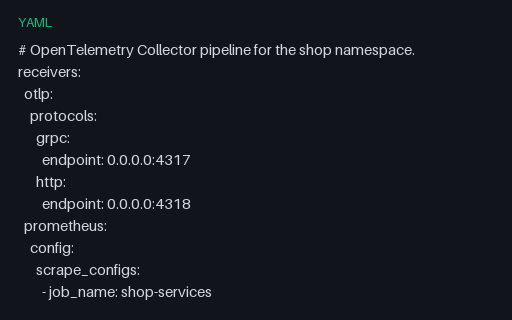
A Collector configuration wiring traces, metrics and logs through separate pipelines, with named component instances, a filelog receiver that parses the CRI log fixture, OTTL statements performing the semantic-convention migration from the paired trace fixtures, and a redaction processor.
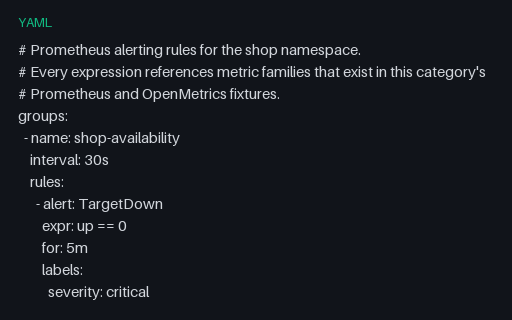
Four alerting rules over two groups, using the YAML features that break naive config readers: block scalars for multi-line PromQL, folded scalars for descriptions, Go template annotations with pipes, and keep_firing_for. Every expression references metrics that exist in this category's fixtures.
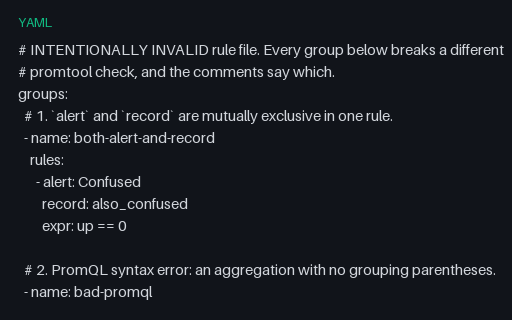
A rule file that is perfectly valid YAML and completely invalid as Prometheus rules: a rule that is both an alert and a recording rule, a PromQL syntax error, a duplicated group name, a rule with no expr and a duration written in prose. Intentionally invalid, with each fault labelled in place.
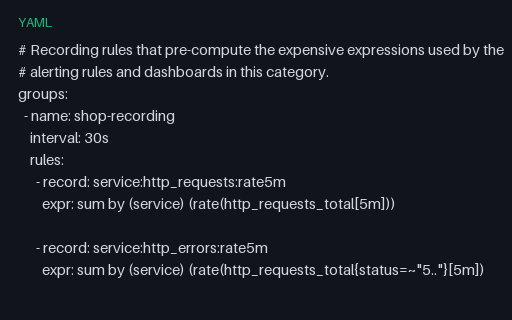
Five recording rules following the level:metric:operation naming convention, where one rule consumes two others recorded earlier in the same group — evaluation order inside a group is sequential, which is exactly what makes that legal and what a rule validator must understand.
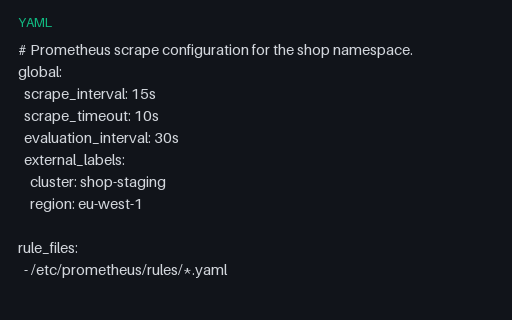
Three scrape jobs with the parts that actually matter: relabel_configs rewriting a target label with a capture group, metric_relabel_configs dropping the two unbounded labels from the cardinality fixture, honor_timestamps for the textfile collector and a federation job with a match[] selector.
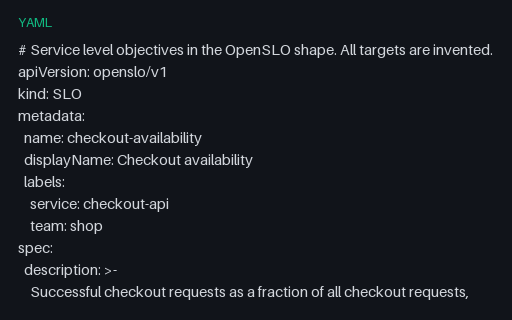
Two SLOs — availability and latency — in one multi-document YAML separated by ---, each defined as a ratio of good events to total over a rolling 28-day window. The latency SLO measures the le="1" bucket against the count, which is the correct way to do it from a histogram.
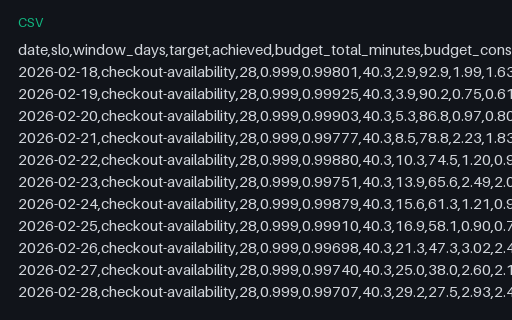
A day-by-day burndown of the availability SLO defined in the OpenSLO fixture: achieved ratio, budget consumed and remaining, and one-hour and six-hour burn rates. Consumption is monotonic across the window, which is the invariant a burn-rate chart must not violate.
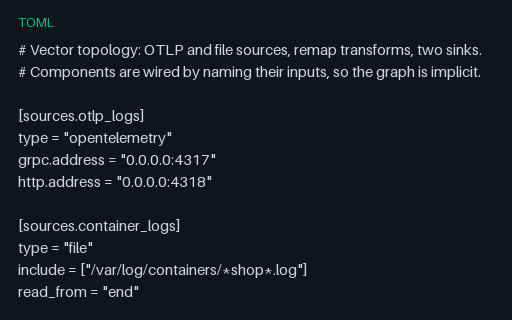
A log-processing topology in TOML where components declare their inputs rather than an explicit graph, including a dropped-event route consumed as parse_json.dropped. The transform bodies are triple-quoted multi-line strings holding a different language, which is what breaks TOML tooling here.
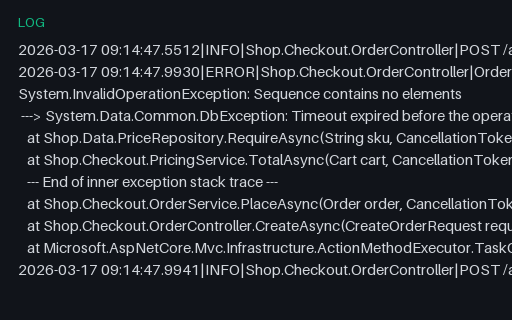
A .NET exception whose inner exception is introduced by the ---> marker and closed by End of inner exception stack trace, wrapped in pipe-delimited log lines. Error groupers that key on the outermost message alone merge two genuinely different faults here.
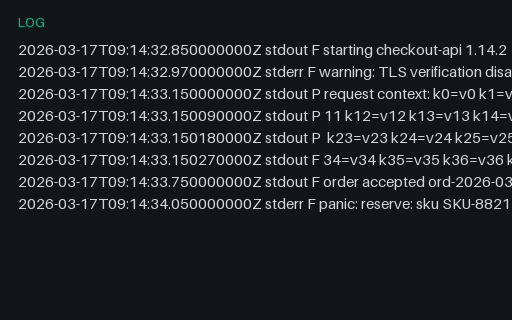
The CRI log format Kubernetes nodes actually write: an RFC 3339 nanosecond timestamp, a stream name, and an F or P tag marking whether the line is full or a partial continuation. One long message is split across several P lines that must be rejoined before parsing.
Forty service-mesh proxy access records with the fields that make mesh debugging possible: response_flags distinguishing an upstream failure from an overflow, upstream_service_time against total duration, upstream host and cluster, and a request ID for correlation.
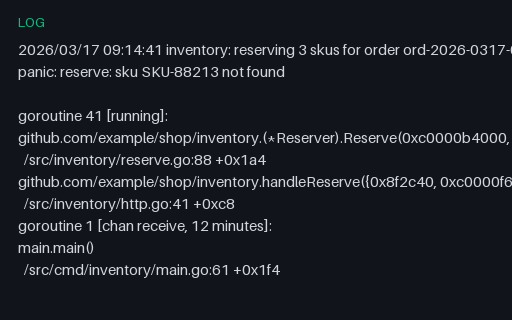
A Go panic followed by the runtime's full goroutine dump — four goroutines with their wait states, two-line frames and a created by attribution, separated by blank lines. Blank-line separation defeats multi-line rules that treat an empty line as the end of an event.
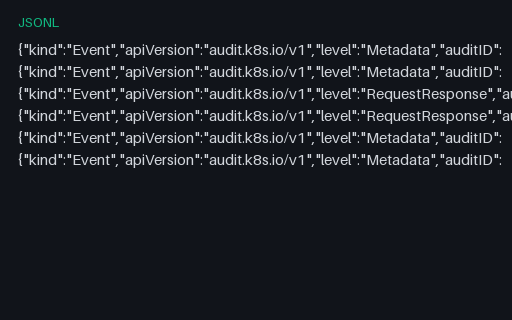
Six Kubernetes audit events at two audit levels, including one 403 whose authorization annotations record the forbid decision and its reason. The shape a cluster-audit alert or compliance report reads, with every user and service account invented.
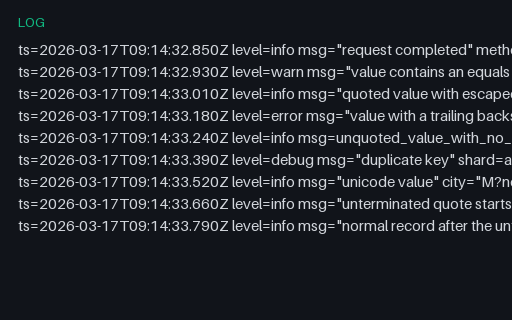
logfmt lines built to break naive splitting on spaces and equals signs: a value containing an equals sign, escaped quotes, a trailing backslash before the closing quote, a bare key with no value, duplicate keys, non-ASCII values and one unterminated quote followed by a clean line.
An OTLP logs export across two resources: five records spanning DEBUG to FATAL with both severityNumber and severityText, separate event and observed timestamps, trace and span correlation, and one record whose body is a full multi-line Python traceback.
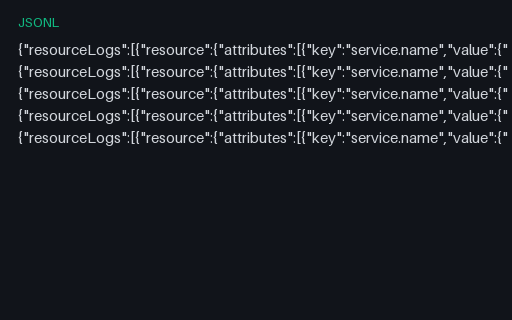
The same five OTLP log records reframed as one self-contained export per line, with the resource attributes repeated on every line. The trade a line-oriented sink makes: each line stands alone, at the cost of repeating the resource block five times.
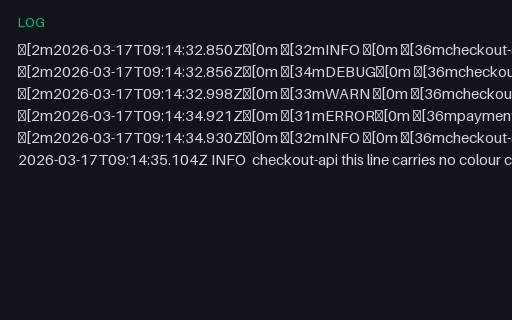
A developer-mode log where the level and service are wrapped in ANSI colour codes, ending with one uncoloured line. Colour codes sit inside the field a parser wants to read, so level extraction fails unless the sequences are stripped first — the classic symptom of a container run without a TTY check.
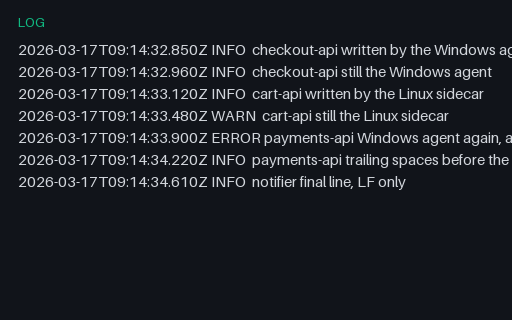
One log file written by two agents, four lines ending CRLF and three LF, with one line carrying trailing spaces before its break. Splitting on \n alone leaves a stray carriage return at the end of four fields, which is how a level or status ends up with an invisible character attached.
A Spring-style text log where two stack traces span many physical lines. Eight logical events across a larger number of lines, so a shipper's multi-line rule — anything not starting with a timestamp continues the previous event — can be scored against a known answer.
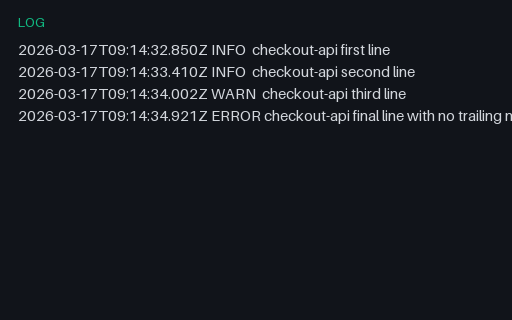
Four log lines where the last has no terminating newline — the normal state of any file still open for append. A tailer that only emits on seeing a newline holds that fourth line forever, which is why the newest error is the one missing from the dashboard.
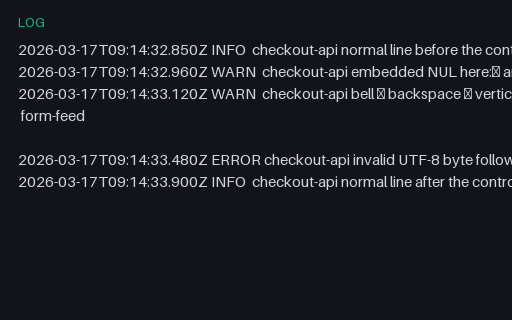
Five log lines carrying a NUL byte, bell, backspace, vertical tab and form feed, plus one 0xFF byte that is not valid UTF-8 — the debris that arrives when binary data reaches a log field. Deliberately contains no terminal-escape sequences, only inert control bytes.
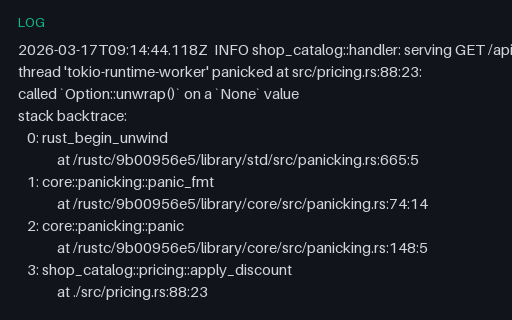
A Rust panic surrounded by ordinary tracing output: the panic location with line and column, a six-frame numbered backtrace where every frame spans two lines, and the RUST_BACKTRACE note. Frame numbering and the deep indent are what a generic stack parser gets wrong here.
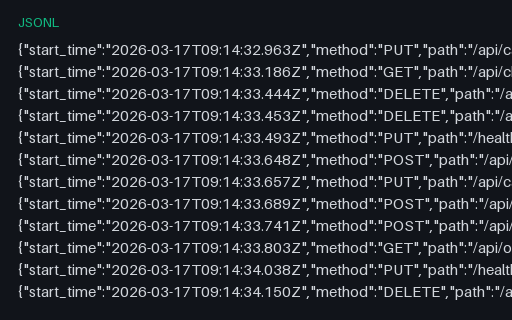
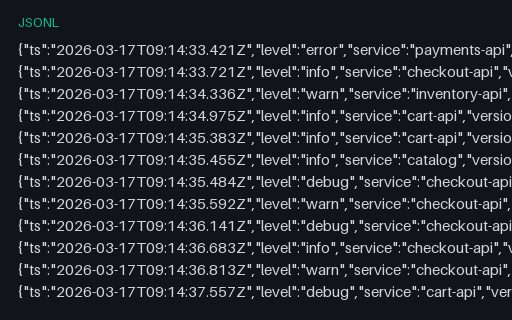
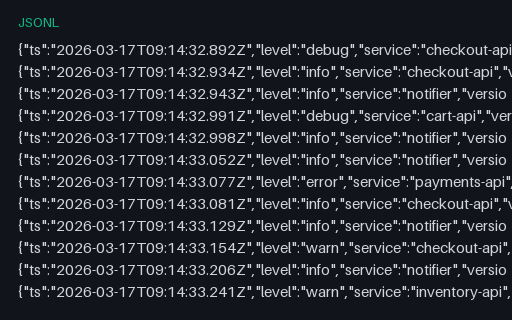
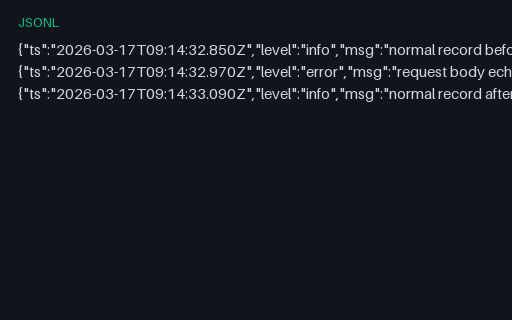
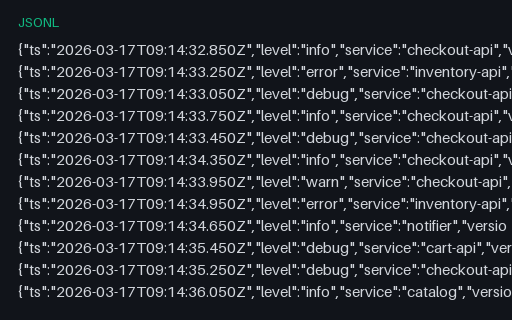
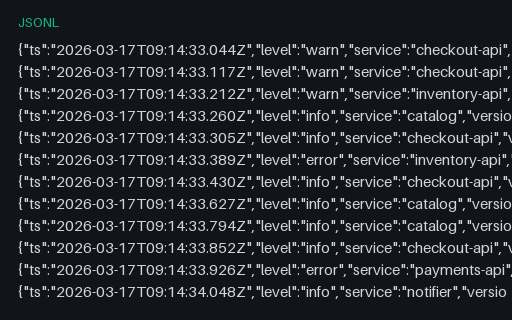
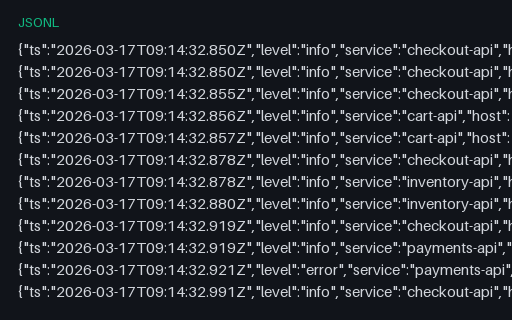
Three hundred newline-delimited JSON log records from five services, each with a timestamp, level, logger, message, a nested http object and request and order identifiers. The severity mix is counted in the spec table, so a level filter can be asserted rather than eyeballed.
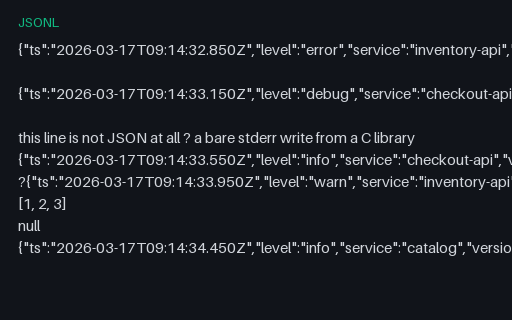
A JSON Lines file with the debris a real container stream carries: blank and whitespace-only lines, one bare stderr write from a C library, a mid-file byte-order mark and two lines that are valid JSON but not objects. Five real records are in there.
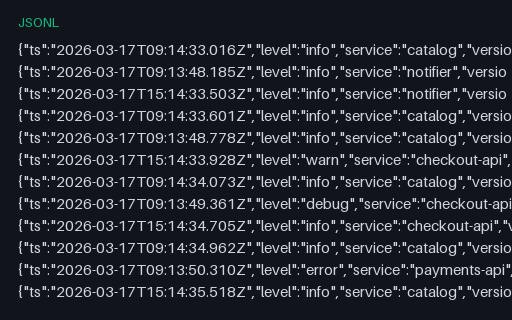
Three hosts writing to one stream with disagreeing clocks: one 45 seconds behind and one six hours ahead because NTP is unreachable. Interleaved by host, so a naive tail shows events from the future and a retention window silently drops the past.
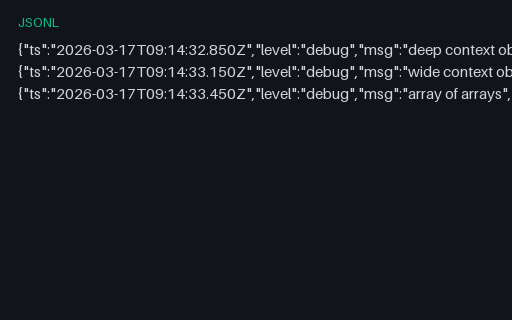
One record nested 24 levels deep, one with 200 sibling keys and one holding a 12 by 12 array of arrays. Field-flattening pipelines turn these into hundreds of dotted keys, and depth limits truncate them silently — this is where both behaviours become visible.
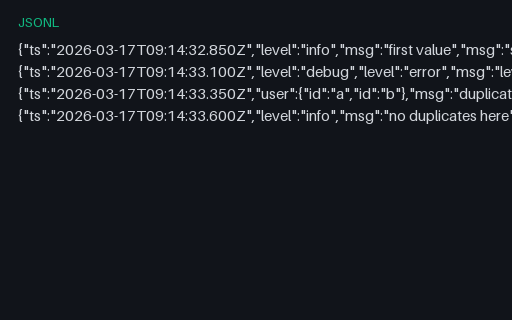
Records whose objects declare the same key twice, including one where the duplicate changes the severity from debug to error. RFC 8259 permits duplicate names and leaves the outcome undefined, so last-wins and first-wins parsers disagree about what these records say.
Every record carries five fields that are unique to it — session, customer, device, pod name and container ID. Harmless as log text, ruinous the moment they are promoted to indexed labels, which is the mistake this fixture exists to make measurable.
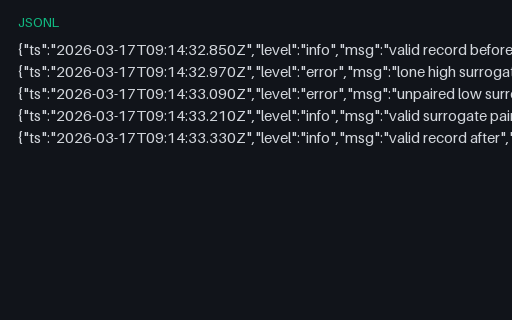
Two records containing unpaired \ud800 and \udfff escapes between three well-formed ones, plus a correct surrogate pair for comparison. Intentionally invalid: the escapes are syntactically legal JSON but cannot be encoded as UTF-8, which is where a re-serialising pipeline breaks.
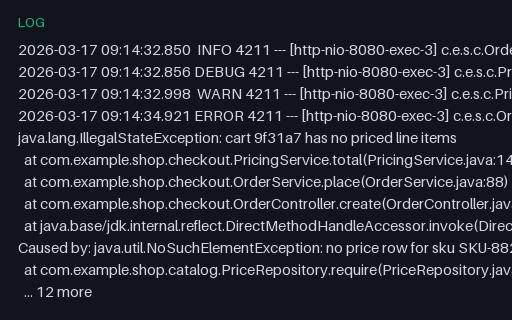
Java, Python and Go stack traces carried inside JSON string fields with their newlines escaped — the shape a structured logger produces, and the one that defeats multi-line joining rules written for plain text. Includes a Caused by chain and a goroutine dump.
A single record of about 75 KB — a request body accidentally logged — sitting between two ordinary ones. Most shippers cap a line at 16 or 64 KB and either split it into invalid JSON fragments or drop the records around it; this file makes which one happen visible.
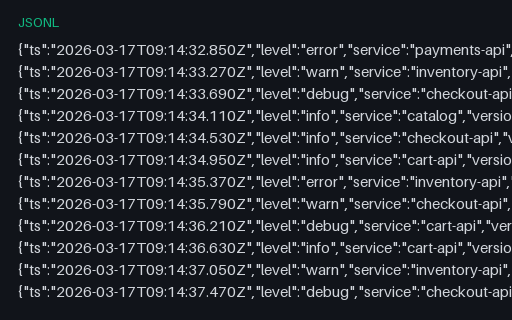
Records whose ts field moves backwards seven times while emitted_seq stays monotonic — what a buffered shipper produces when several workers flush concurrently. The fixture for sort-on-ingest, late-arrival windows and any index that assumes append order equals time order.
Logs that record their own sampling decision, with periodic dropped_since_last counters so the true event rate can be reconstructed from a sampled stream. Counting sampled records as if they were the whole population is the mistake this fixture is built to expose.
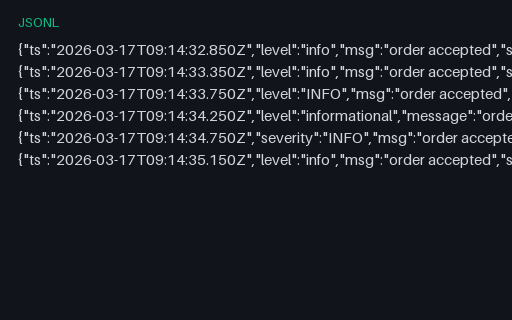
Six records that all mean the same thing and disagree about how to say it: status as a number, a string, a float and the text OK; user as a string, an object and null; tags as an array and a scalar; and the level and message fields renamed. The mapping conflict that stops an index mid-ingest.
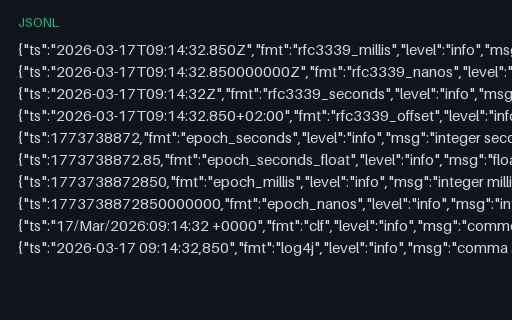
The same instant written ten ways — RFC 3339 at three precisions and with a non-UTC offset, epoch seconds as integer and float, epoch milliseconds and nanoseconds, Common Log Format and the log4j comma-decimal form. What a timestamp autodetector must resolve to one moment.
One log record per span of the canonical checkout trace, each carrying trace_id, span_id, parent_span_id and trace flags. The logs-to-traces jump with a target that actually exists in this catalog, so a correlation query can be verified end to end.
Twelve complete JSON records followed by a thirteenth cut off after 96 bytes with no trailing newline, exactly as a container log looks when the process is killed mid-write. Intentionally corrupt and small: a tailer must hold the partial line for a continuation rather than emit or discard it.
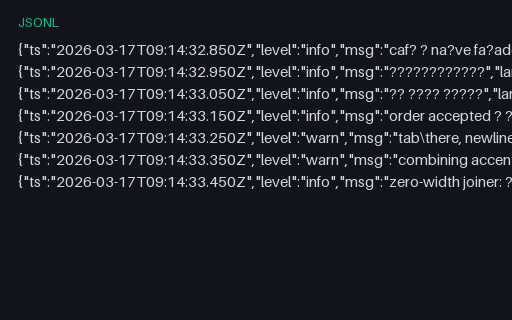
Log messages in Latin, Japanese and Arabic scripts, an emoji flag and a zero-width-joiner family, NFC and NFD forms of the same accented letter, and escaped tab, newline and carriage return. Everything that makes a log line's byte length and its display width disagree.
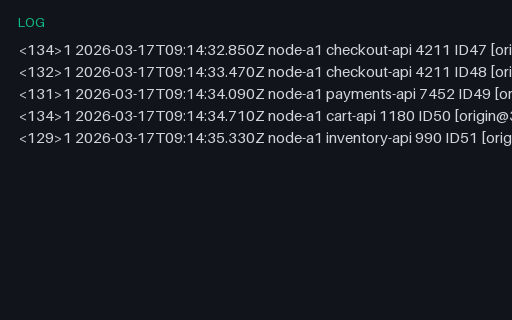
Five RFC 5424 syslog messages with the version digit, a full RFC 3339 timestamp and two structured-data elements per line — including one carrying the trace ID from this category's trace fixtures. The modern syslog most parsers still handle as if it were RFC 3164.
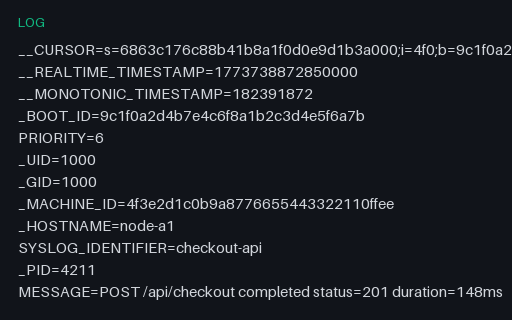
Five journal entries in systemd's export format — KEY=value lines separated by blank lines, with the double-underscore address fields, a syslog PRIORITY number rather than a level name, and microsecond timestamps. A parser must map priority 3 to error and 6 to info itself.
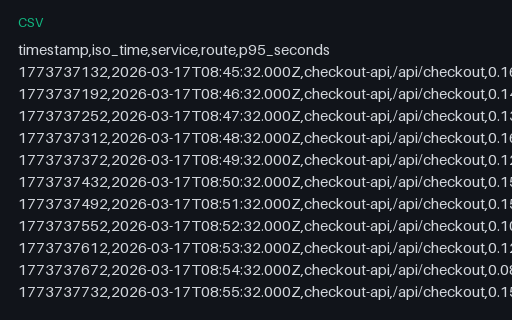
The same 90 samples as the query_range response, exported one row per observation with both epoch and ISO 8601 timestamps. The long layout every dataframe library prefers, and half of a reshaping pair.
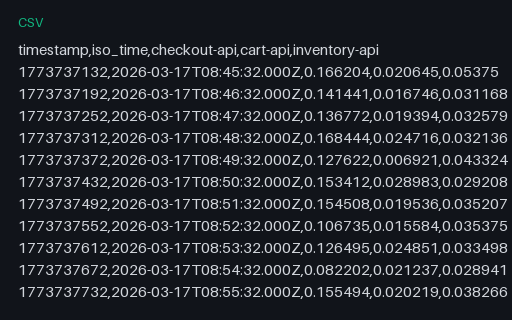
The same 90 samples pivoted to one column per service and one row per timestamp — the layout a spreadsheet chart expects. Paired with the long-format export so a reshape can be scored in both directions.
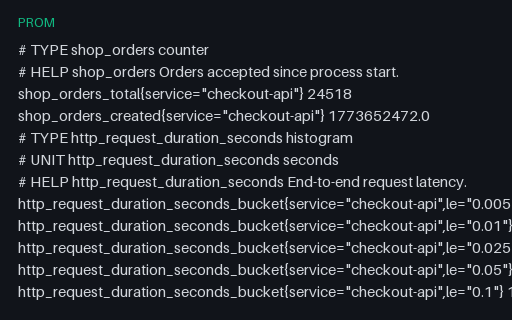
A complete OpenMetrics document — the _total and _created series a counter really has, UNIT metadata, an info metric carrying build metadata and a stateset with exactly one active state — terminated by the mandatory # EOF. This is what the exposition format became once it was standardised.
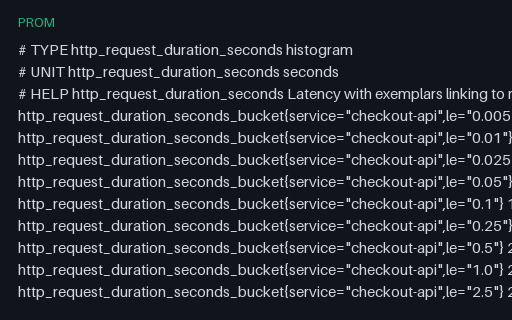
Histogram buckets carrying exemplars whose trace_id and span_id resolve against the OTLP trace fixtures in this category — the exact-to-example link that turns a latency spike on a graph into a specific request. Five exemplars, each with its own observed value and timestamp.
A document that parses perfectly as Prometheus text and is invalid as OpenMetrics, because the mandatory # EOF terminator is missing. That marker is the format's only defence against a truncated response being accepted as complete — which is the exact failure this file reproduces.
An exponential histogram at scale 3 — eight buckets per power of two — with a negative offset, a zero bucket and its threshold. Bucket i covers (base^(offset+i), base^(offset+i+1)], and getting that indexing wrong silently shifts every percentile, which is what this fixture is for.
A monotonic counter that drops from 94,880 to 1,120 when its process restarts, with startTimeUnixNano changing at exactly that point to mark the reset. Rate calculations that subtract consecutive values without checking the start timestamp produce a large negative rate here.
Cumulative sums whose start timestamp stays fixed across exports, so every point is the running total since process start. Paired with a delta-temporality twin covering the same window, because converting between the two is a stateful operation that a bridge must get right in both directions.
The same 24 hours of cart updates as six delta points, each with its own start and end timestamp covering a four-hour window. The delta twin of the cumulative fixture: summing these must reproduce the cumulative total exactly, and a gap or overlap in the windows is the failure to catch.
An OTLP histogram carrying two exemplars, each with the trace and span ID of a request that landed in that bucket — including the 2.0031-second outlier that corresponds to the failed payment in the error-trace fixture. The metrics-to-traces jump, with a resolvable target.
An OTLP explicit-bucket histogram over the same latency distribution as the Prometheus fixture — but with per-bucket counts rather than cumulative ones, and one more bucket count than bounds. Converting between the two is where most OTLP-to-Prometheus bridges get the arithmetic wrong.
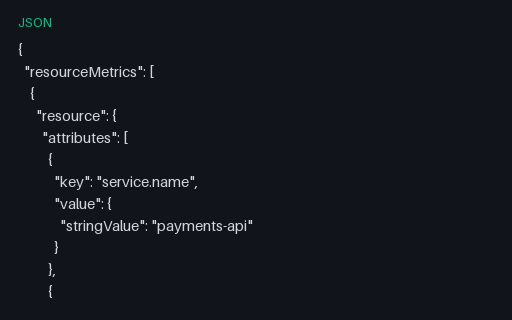
An OTLP metrics export with a monotonic cumulative sum and two gauges, showing the parts of the wire format that trip parsers: int data points serialised as JSON strings, UCUM unit annotations like {request} and By, and the start timestamp that makes a counter reset detectable.
The OTLP summary type — quantiles computed on the client, kept only for translating legacy Prometheus summaries. It carries the same four quantiles as the Prometheus summary fixture, and like that one it cannot be re-aggregated across instances without producing a wrong number.
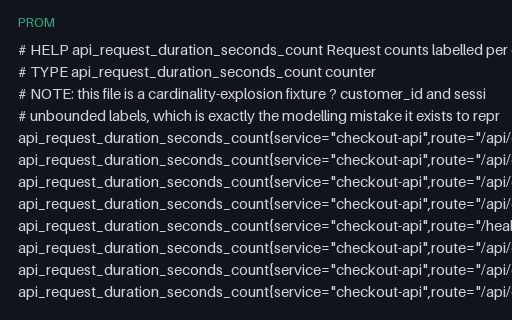
A single metric family blown up to 2,000 series by two unbounded labels — customer_id and session_id — which is the most common way a metrics bill and a TSDB both fall over. A load fixture for scrape parsing and a worked example for cardinality-limit rules.
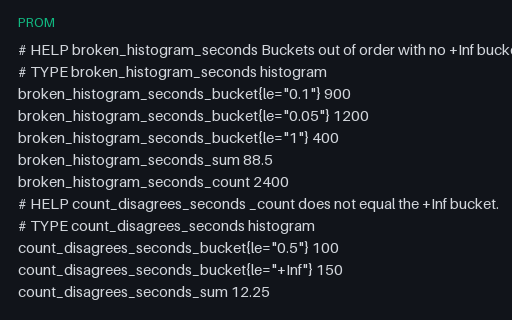
Two histogram families that are syntactically fine and semantically wrong: one has non-monotonic buckets and no +Inf bucket, the other reports a _count larger than its +Inf bucket. Intentionally invalid, because histogram_quantile over either produces a confidently wrong number rather than an error.
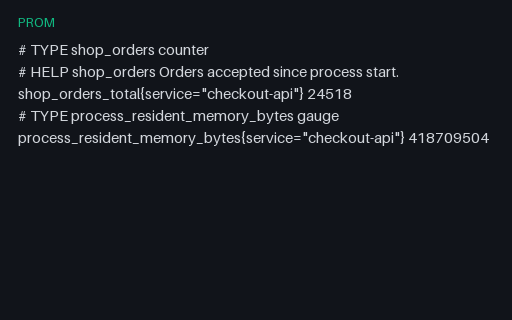
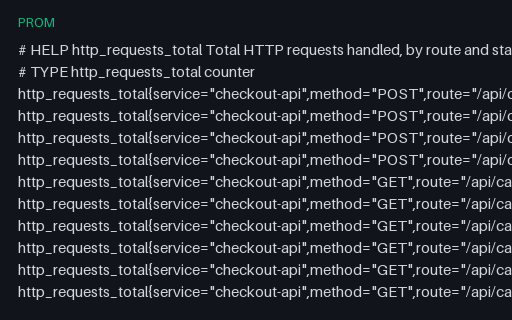
The body a /metrics endpoint returns: five metric families with HELP and TYPE metadata across 27 labelled series — request counters by route and status, process and runtime gauges, per-target up values (one deliberately 0) and a business gauge. The baseline exposition-parser fixture.
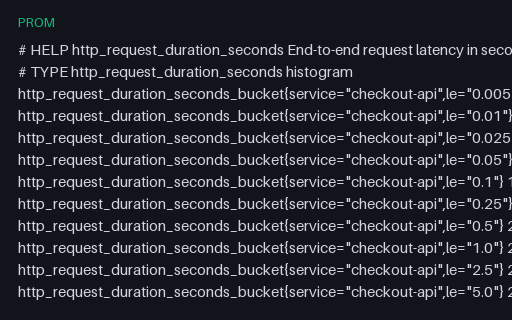
A classic Prometheus histogram: eleven finite le buckets plus +Inf, with monotonically non-decreasing cumulative counts and matching _sum and _count series. The fixture for bucket ordering, cumulative arithmetic and histogram_quantile interpolation.
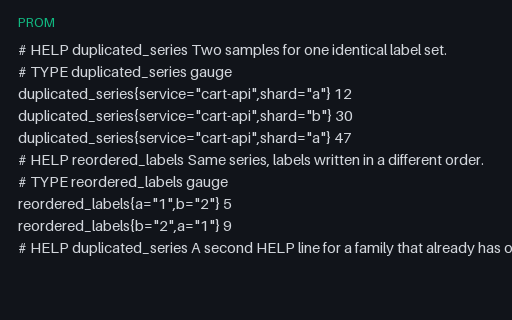
One label set exposed twice, a second pair that is only a duplicate once labels are sorted, and a repeated HELP line. Intentionally invalid: a scrape must fail rather than let last-write-wins decide which of two values for the same series survives.
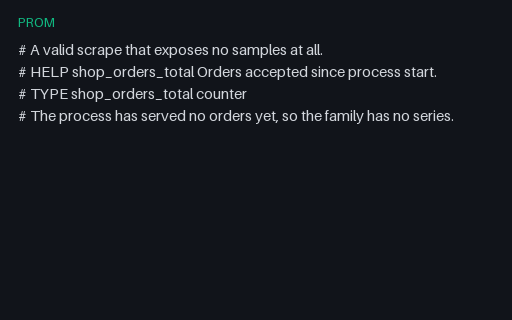
A scrape body with metadata but no samples, which is what a freshly started process returns before it has recorded anything. Valid, and routinely mistaken for a failed scrape by code that treats an empty result as an error.
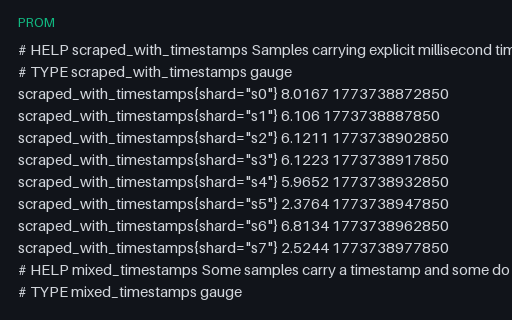
Samples with explicit millisecond timestamps alongside samples without any, including one an hour stale and one an hour in the future. Optional timestamps are the part of the exposition format most parsers get wrong, and out-of-window samples are what a scraper must reject rather than backfill.
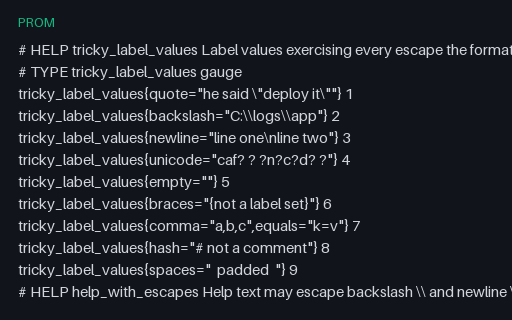
Ten series whose label values contain the characters that break naive line splitting — escaped quotes and backslashes, an escaped newline, non-ASCII text, braces, commas, equals signs, a leading hash and significant whitespace. The exposition format defines exactly three escapes and this file uses all of them.
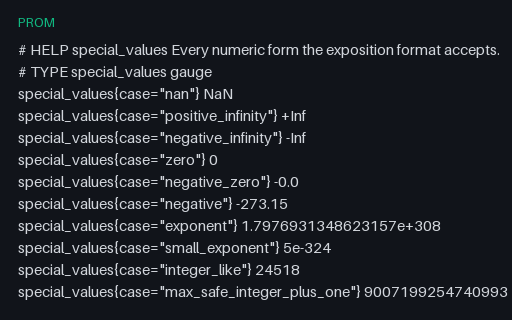
Every numeric form the exposition format permits: NaN, +Inf and -Inf, negative zero, denormal and maximum doubles, and a uint64 counter beyond the exact range of a double. Parsers that route values through a JSON number or a 32-bit float fail on this file specifically.
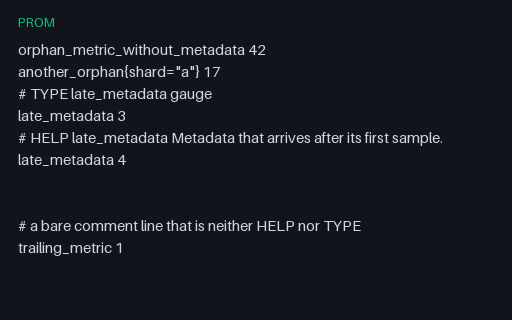
Samples exposed with no HELP or TYPE at all, metadata arriving after the sample it describes, blank and whitespace-only lines and a bare comment. All of it is legal — metadata is optional — and all of it breaks parsers that assume every sample is introduced by a TYPE line.
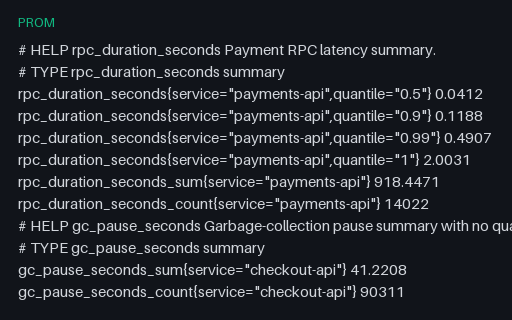
Two summary families — one exposing four client-side quantiles including quantile="1" for the observed maximum, and one exposing only _sum and _count, which is legal and common. Summaries cannot be re-aggregated across instances, and this fixture is where that gets tested.
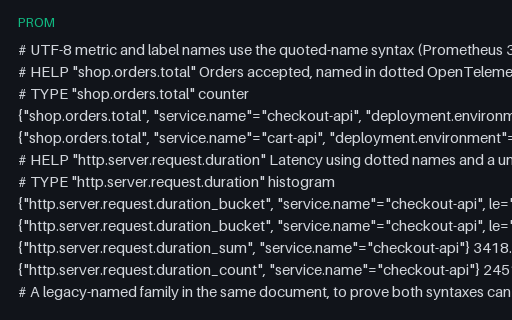
Dotted OpenTelemetry-style metric and label names written with the quoted-name syntax that Prometheus 3 accepts, mixed in one document with a legacy underscore-named family. The fixture for parsers that still assume every name matches [a-zA-Z_][a-zA-Z0-9_]*.
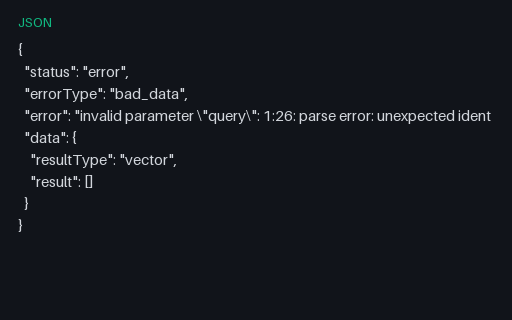
The error envelope a Prometheus API returns for a malformed PromQL query — status, errorType, a message with a line and column position, and an empty but present data object. Clients that only check for a data key render this as a successful empty result.
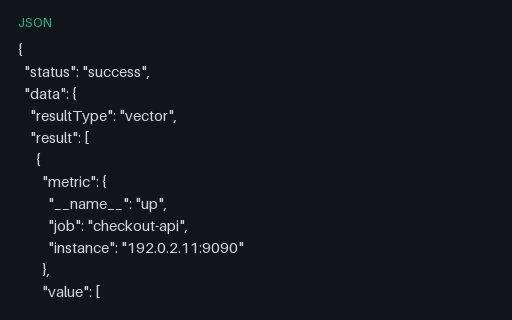
An instant-query response: five up series at a single evaluation timestamp, one of them zero, plus a warnings array that clients routinely ignore. A successful response can carry warnings, and dropping them hides truncated results.
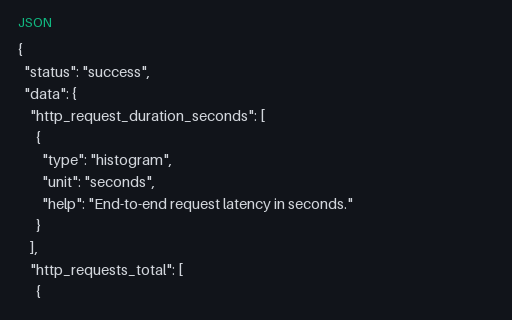
The metadata endpoint's response, where each metric name maps to a list because different targets can disagree. http_requests_total here has two conflicting HELP strings — the real-world state that a metric catalogue or documentation generator has to resolve rather than assume away.
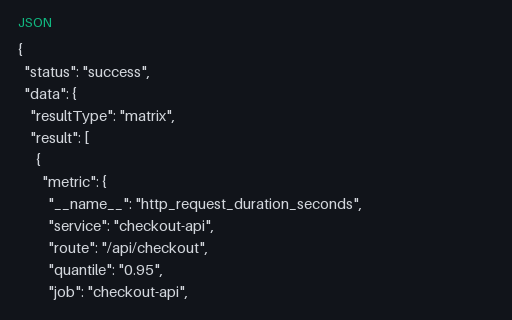
A Prometheus /api/v1/query_range response: three labelled series of 30 points each at a 60-second step, with sample values as JSON strings and timestamps as float seconds. The exact envelope a dashboard client has to unpack, including the string-typed values that break naive charting code.
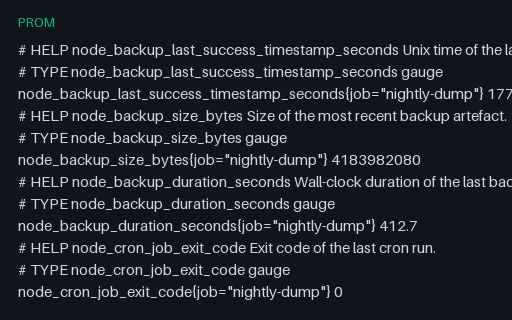
The file a cron job drops into the node_exporter textfile directory so a batch task can be monitored without a scrape endpoint: last-success timestamp, artefact size, duration and per-job exit codes, one of which is non-zero. The canonical shape for batch-job alerting.
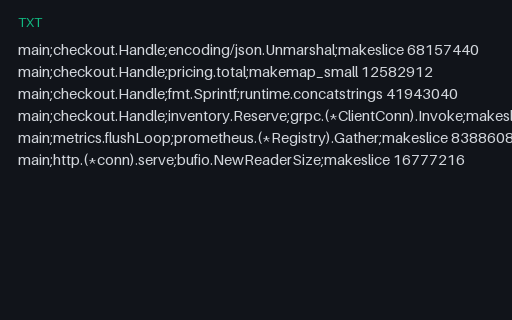
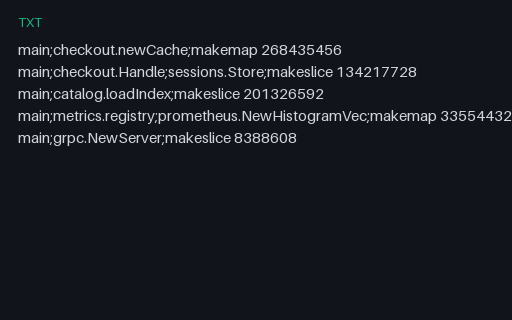
An allocation profile in the same folded syntax as the CPU profiles, but weighted in bytes rather than samples. The format carries no unit, so a viewer that assumes samples renders 65 MB of allocation as 68 million samples — which is what this fixture is for.
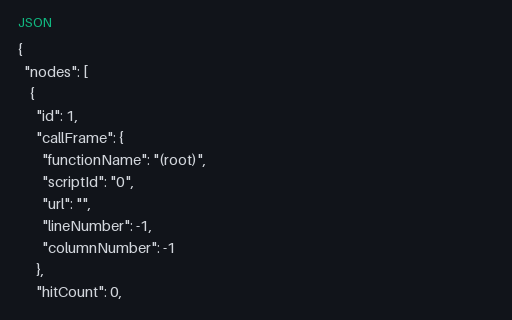
The .cpuprofile shape V8 emits: a node tree with call frames, a samples array of node IDs and a parallel timeDeltas array, plus the synthesized (idle), (program) and (garbage collector) nodes. Counting those synthetic frames as application time is the classic misreading.
The same workload after a change: JSON decoding costs four times as much and gains a new reflect frame, while cache lookups get cheaper. Paired with the baseline so a differential flamegraph can be scored against a known regression and a known improvement.
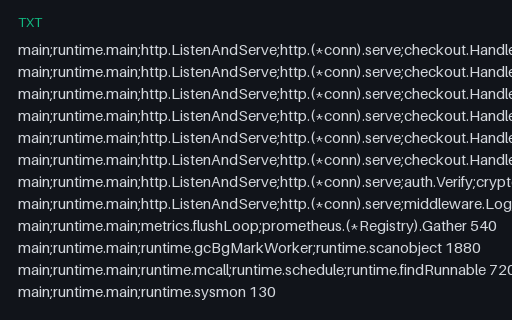
A CPU profile in the folded-stack format every flamegraph tool reads: one line per unique stack, frames separated by semicolons, then a space and a sample count. Twelve stacks up to seven frames deep, with the runtime's GC and scheduler work included as real profiles have.
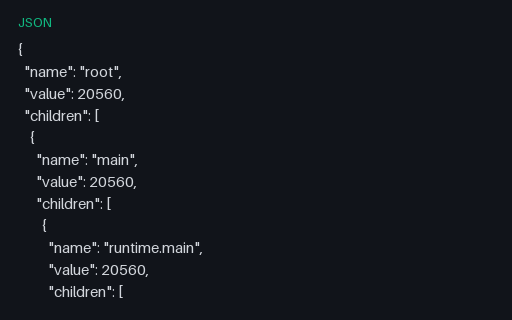
The folded CPU profile after aggregation into the nested name, value and children hierarchy that d3-flame-graph and most web viewers consume. Every node's value equals its own self time plus its children's, which is the invariant a converter must preserve.
A heap profile measuring bytes still live at the sample point, not bytes ever allocated — which is why its shape differs from the allocation profile of the same process. 620 MB retained across five sites, with an unbounded session cache at the top.
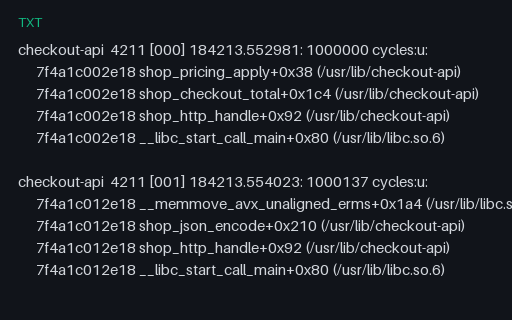
Raw perf script output — a header line per sample followed by tab-indented call-chain frames with addresses, symbols, offsets and DSO paths, samples separated by blank lines. The input side of stackcollapse, including unresolved frames a symbolizer could not name.
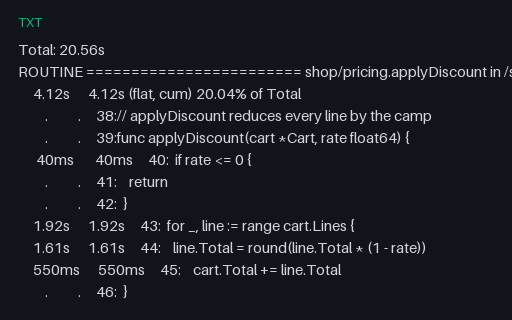
Line-level profile output: two routines with per-source-line flat and cumulative cost, a dot for lines that cost nothing, and units that switch between seconds and milliseconds within one column. Source lines keep their real tabs, which most column parsers do not survive.
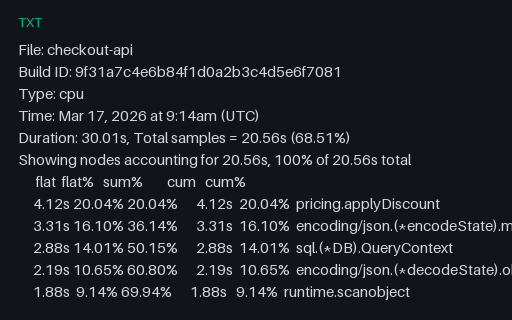
The text report pprof prints for the same profile as the folded fixtures: a metadata header, then flat and cumulative columns where frames that are never a leaf carry zero flat time and near-total cumulative time. Column-aligned output with a bare 0 rather than 0s, which is where naive column parsing fails.
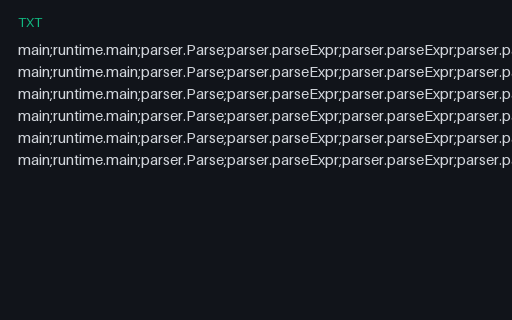
A recursive-descent parser profiled mid-recursion: stacks up to 204 frames deep where one frame repeats 200 times, on lines over 3,000 characters. Flamegraph renderers with a fixed depth limit truncate this silently, and line-length limits split it into nonsense.
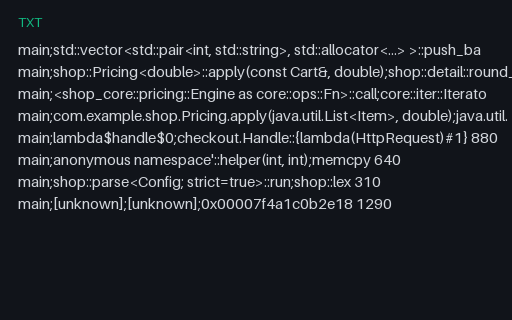
Demangled C++ templates, Rust trait impls, Java generics, lambdas and unresolved hex addresses in the folded format — including one symbol containing a semicolon, which the format has no way to escape. That line is genuinely ambiguous, and how a parser handles it is the point.
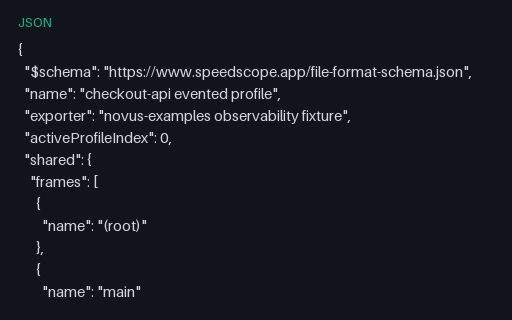
The evented half of the speedscope format — explicit O and C events that must nest like brackets, rather than sampled stacks. Tracing profilers emit this shape, and an unbalanced or out-of-order close is the corruption a loader has to detect.
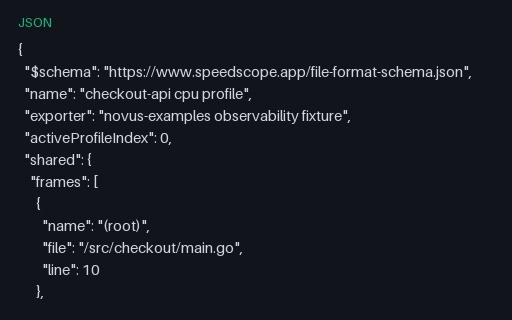
A speedscope sampled profile: one shared frame table with source locations, then stacks expressed as arrays of frame indices with per-sample weights in nanoseconds. The index indirection is the whole design, and resolving it wrong produces a plausible but wrong flamegraph.
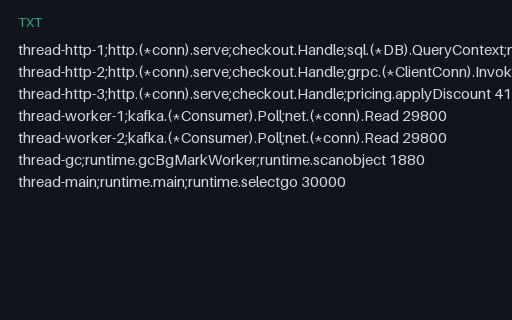
A 30-second wall-clock profile with the thread name as the root frame, so time blocked in reads is visible instead of invisible. Off-CPU time dominates — the shape that tells you a service is waiting, not computing, which a CPU profile alone cannot show.
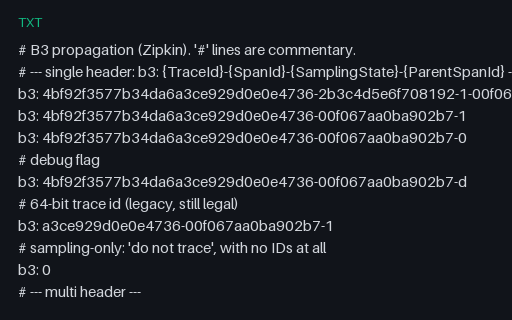
B3 context propagation in both shapes — the compact single b3 header including the debug flag, a legacy 64-bit trace ID and the sampling-only form, plus the five X-B3-* multi-header fields — with two malformed values that must be rejected.
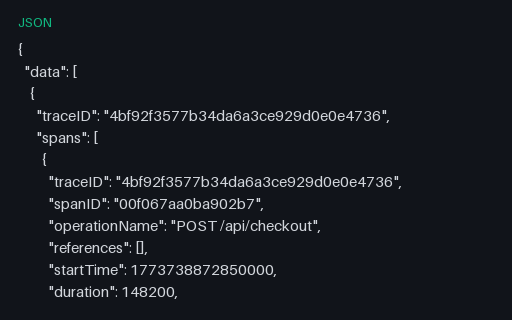
The checkout trace in the Jaeger query-API shape — a data array holding one trace, spans carrying microsecond startTime and duration, CHILD_OF references, typed tags and a per-service processes map. The same span tree as the OTLP and Zipkin twins, so a converter can be scored exactly.
A single-service trace 48 levels deep — a recursive GraphQL-style resolver where every span is the child of the one before it. A depth fixture for waterfall renderers, tree-layout code and any parser that recurses over parentage.
One root span with 60 overlapping children — a scatter-gather query across database shards. The counterpart to the deep-chain fixture: shallow but very wide, which is what breaks waterfall layouts that assume spans do not overlap in time.
A trace whose trace ID and root span ID are all zeroes — the value an uninitialised context produces. Intentionally invalid: the specification defines all-zero IDs as invalid, so a conformant receiver must reject the spans instead of creating a permanent bucket that every broken service writes into.
One span carrying every OTLP AnyValue kind — string (plain, Unicode, multi-line, empty), int64 encoded as a JSON string, double, bool, array, nested kvlist and base64 bytes. Includes an integer above 2^53 to catch decoders that route int64 through a JavaScript number.
Two hosts whose clocks disagree by 12 ms, so a server span appears to start before the client span that called it. Nothing in the payload is malformed — this is the most common real cause of a negative-latency gap in a waterfall, and viewers must show it rather than crash or silently reorder.
Two different spans share one span ID inside a single trace, which the specification forbids. Intentionally invalid: it is the fixture for the de-duplication path, where a naive store silently overwrites one span with the other and loses a subtree.
A structurally valid OTLP export containing no spans at all — what an exporter sends when every span in the interval was sampled out. The empty-input case that ingestion code routinely mistakes for an error.
A failed checkout: an upstream payment timeout sets ERROR status on four spans up the chain and attaches an exception event whose exception.stacktrace attribute holds a real multi-line Python traceback with embedded newlines. The fixture for error grouping, status propagation and multi-line attribute rendering.
A trace annotated with the sampling decision that let it through — sampler type and ratio on every span, plus a sampling.priority override on the root. The fixture for testing that a tail-sampling processor reads the existing decision instead of re-deciding and splitting the trace.
One HTTP server span using the old OpenTelemetry attribute names — http.method, http.url, http.status_code, net.peer.ip — and the old low-cardinality span name. Paired with its modern twin so a migration shim can be tested against a known before-and-after.
One span ends 8.4 ms before it started and another has identical start and end timestamps. Intentionally invalid: negative durations poison latency aggregates — a single one can drag a p99 below zero — so this is the fixture for the validation that must sit in front of any duration metric.
The checkout trace with one intermediate span dropped, as happens when an exporter's queue overflows. Three spans now reference a parent that is not in the payload — a partial trace that a store must render rather than reject.
The consumer half of the checkout flow, in its own trace. Its root CONSUMER span carries a link — not a parent reference — back to the producer span in the checkout trace, which is how a batching consumer joins work produced elsewhere. A fixture for link resolution and cross-trace navigation.
The canonical checkout trace with its spans emitted in the order they finished — children before parents, deepest first. This is what a real batch exporter produces, and a consumer that assumes parents arrive first will drop or orphan most of the trace.
The same HTTP server span written with the stable attribute names — http.request.method, url.path, http.response.status_code, client.address — and the route-templated span name the stable conventions require. The target state for a migration shim.
The same 13-span trace serialised the way a stock proto3 JSON marshaller writes it: trace and span IDs base64-encoded and span kind and status as enum names rather than numbers. Paired with the hex/numeric OTLP/JSON twin so a receiver can be tested against both encodings of one payload.
An OTLP/JSON export cut off in the middle of an object, the way a file sink looks when the collector is killed mid-write. This file is intentionally corrupt and small: it exists so an ingestion path can be tested for a clean parse error with a byte offset instead of a hang or a half-committed batch.
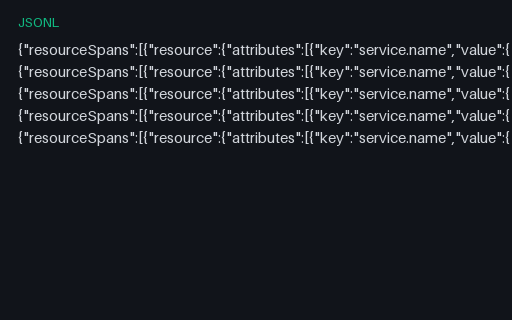
Two traces streamed as newline-delimited OTLP requests, one resource per line, so a single trace is split across several lines exactly as a line-oriented collector sink writes it. A fixture for streaming ingestion, back-pressure and partial-trace assembly.
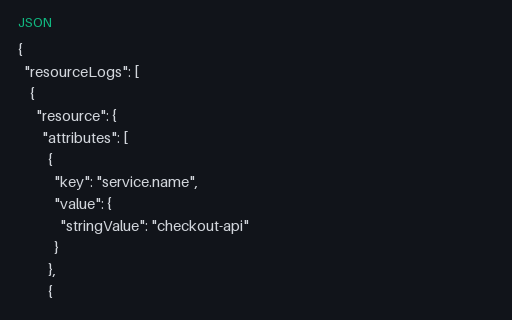
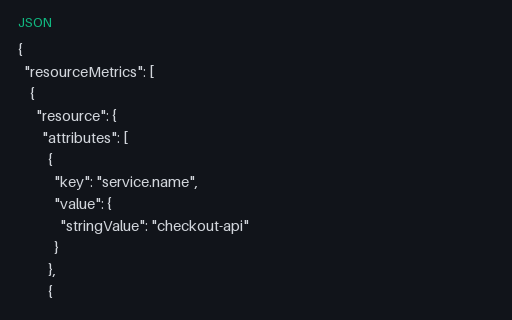
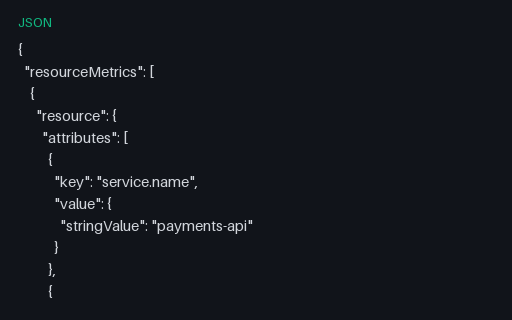
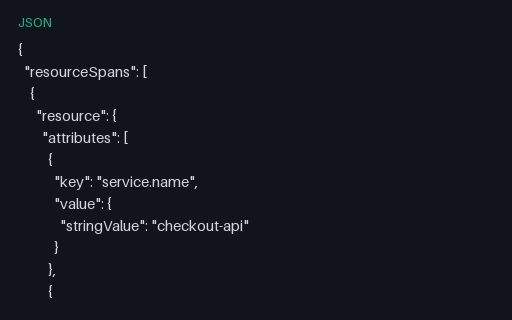
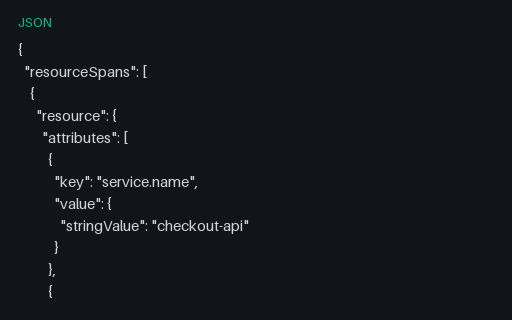
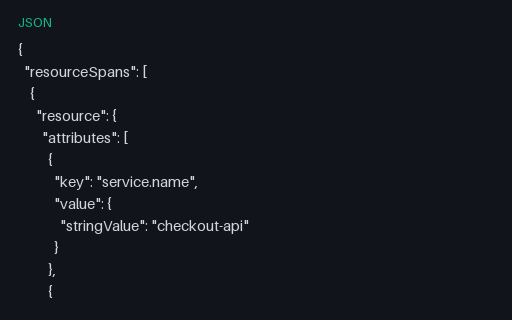
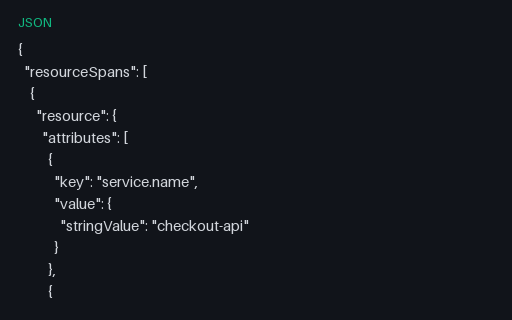
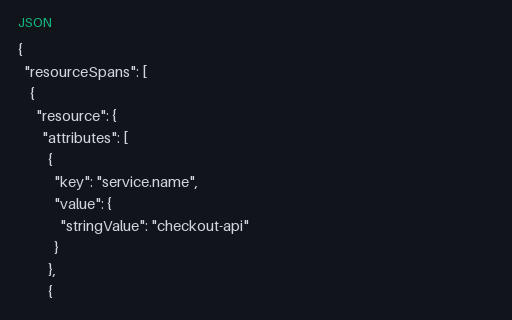
A complete OTLP/JSON trace export: one checkout request across five services as 13 spans, four levels deep, with HTTP, database, RPC and messaging semantic-convention attributes, span events and a producer span. Trace and span IDs are fixed, so ingesting it twice produces identical output.
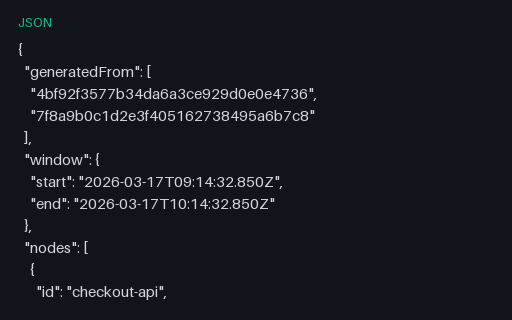
The service map you get by aggregating the trace fixtures in this category — five service nodes and the edges between them with call counts and latency percentiles, including the messaging edge that exists only because of a span link. Ground truth for a service-graph processor.
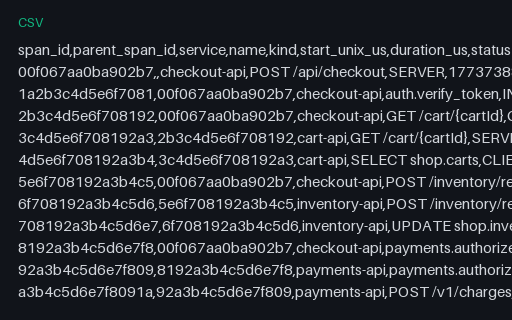
The same 13 spans flattened to a CSV table — span and parent IDs, service, name, kind, start timestamp, duration and status. The shape a trace store exports for spreadsheet analysis, and a readable ground truth to diff the three JSON twins against.
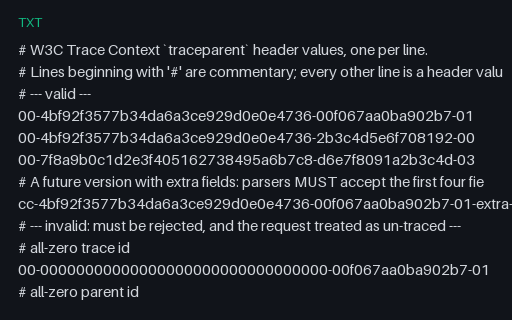
A labelled set of traceparent header values: four that must parse — including a future version with extra fields, which parsers are required to accept — and eight that must be rejected, covering all-zero IDs, version ff, short and uppercase trace IDs, and missing or trailing fields.
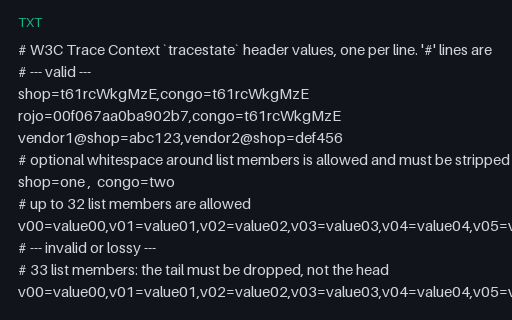
tracestate header values covering vendor-prefixed keys, optional whitespace, the exact 32-member limit and a 33-member case that must lose its last member rather than its first — plus duplicate keys, uppercase keys, a bare key and an over-long key that must be rejected.
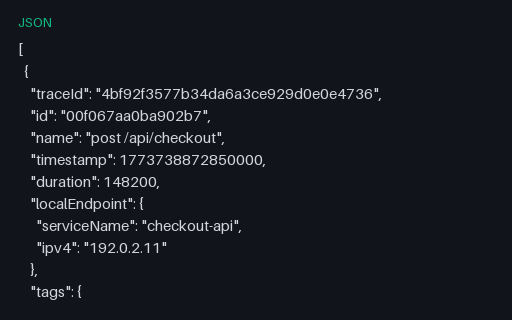
The checkout trace as a flat Zipkin v2 span list with localEndpoint, string-only tags and annotations. Two conversions are deliberately visible: Zipkin has no INTERNAL kind, so those two spans omit kind, and every typed attribute is stringified.
OTLP JSON traces, metrics, and logs, plus Jaeger and Zipkin trace shapes, Prometheus exposition text, structured JSON Lines logs, dashboards, recording/alerting rules, and alert-webhook payloads.
Are trace and span IDs stable between downloads?+
Yes. IDs, timestamps, and durations are fixed and recorded in each file's spec, so two runs of your parser or ingest pipeline produce identical output.
Is this real production telemetry?+
No — every service name, host, and user identifier is invented. These are synthetic fixtures shaped like production data, with no real infrastructure behind them.
We use Google Analytics and show ads via Adsterra. Non-essential cookies and ad scripts run only after you allow the matching categories. See our cookie policy.