
OTLP Metrics — Counter Reset on Process Restart (json)
A monotonic counter that drops from 94,880 to 1,120 when its process restarts, with startTimeUnixNano changing at exactly that point to mark the reset. Rate calculations that subtract consecutive values without checking the start timestamp produce a large negative rate here.
{
  "resourceMetrics": [
    {
      "resource": {
        "attributes": [
          {
            "key": "service.name",
            "value": {
              "stringValue": "cart-api"
            }
          },
          {
            "key": "service.namespace",
            "value": {
              "stringValue": "shop"
            }
          },
          {
            "key": "service.version",
            "value": {
              "stringValue": "0.9.7"
            }
          },
          {
            "key": "service.instance.id",
            "value": {
              "stringValue": "cart-api-58bd21-9qh"
            }
          },
          {
            "key": "deployment.environment.name",
            "value": {
              "stringValue": "staging"
            }
          },
          {
            "key": "host.name",
            "value": {
              "stringValue": "node-a2"
            }
          },
          {
            "key": "host.ip",
            "value": {
              "stringValue": "192.0.2.12"
            }
          },
          {
            "key": "cloud.region",
"value": {Specifications
- Data Points
- 6
- Reset After Point
- 3
- Value Before Reset
- 94880
- Value After Reset
- 1120
- Start Time Changes At Reset
- true
- Naive Delta Would Be
- -93760
Testing contract
Expected to pass- Scenario
- Compute a per-second rate across all six points.
- Expected result
- The reset between points 3 and 4 is detected from the changed startTimeUnixNano and the rate stays positive, rather than reporting the naive -93760 delta.
What is a .json file?
JSON (JavaScript Object Notation) is a lightweight, text-based data-interchange format representing objects, arrays, strings, numbers, booleans, and null. It is language-independent, human-readable, and the dominant format for web APIs and configuration. It requires a single well-formed root value.
How to use this file
Use an example JSON file to test parsers and serializers, schema validation, Unicode and number-precision handling, and API request or response processing.
How to use this file for testing
“OTLP Metrics — Counter Reset on Process Restart (json)” is a deterministic Novus Examples fixture for Observability, Time-series data, Time-series data. Structured and plain-text telemetry with known timestamps, levels, request identifiers, and error states for testing log ingestion, correlation, dashboards, and alert pipelines.
Documented properties for this file: JSON · 5,443 bytes. Compare results against paired or grouped companions on this page when present (clean↔damaged, searchable↔scanned, or format twins) so scores stay reproducible across runs.
Download the file once, keep the path stable in CI or local scripts, and treat the spec table as the contract: dimensions, seeds, field lists, and roles are intentional. Corrupt or invalid samples are labelled as such — expect parsers to fail loudly rather than silently accept them.
Telemetry fixtures use fixed trace IDs, span IDs, and timestamps so ingestion is reproducible run to run. Point your collector, parser, or query layer at the file and assert the documented span tree, metric families, or severity mix; service and host names are invented.
Code examples
import json

with open("otlp-metrics-counter-reset.json") as f:
    data = json.load(f)
print(type(data), len(data))
Related files
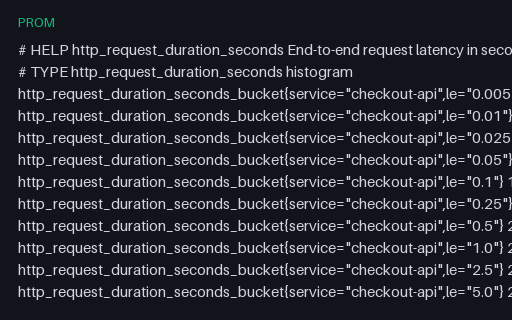
- promPrometheus Exposition — Cumulative Histogram (prom)A classic Prometheus histogram: eleven finite le buckets plus +Inf, with monotonically non-decreasing cumulative counts and matching _sum and _count series. The fixture for bucket ordering, cumulative arithmetic and histogram_quantile interpolation.
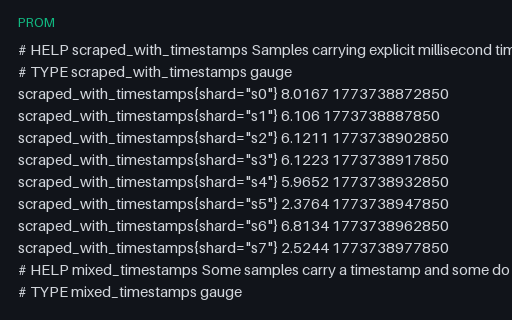
- promPrometheus Exposition — Explicit and Skewed Timestamps (prom)Samples with explicit millisecond timestamps alongside samples without any, including one an hour stale and one an hour in the future. Optional timestamps are the part of the exposition format most parsers get wrong, and out-of-window samples are what a scraper must reject rather than backfill.
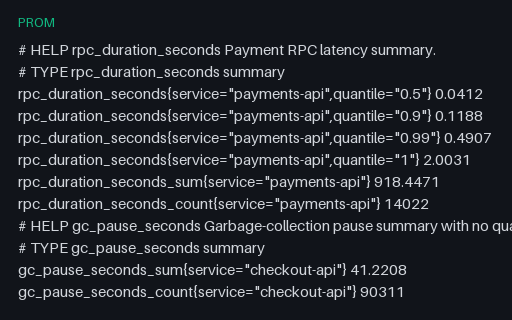
- promPrometheus Exposition — Summary with and without Quantiles (prom)Two summary families — one exposing four client-side quantiles including quantile="1" for the observed maximum, and one exposing only _sum and _count, which is legal and common. Summaries cannot be re-aggregated across instances, and this fixture is where that gets tested.
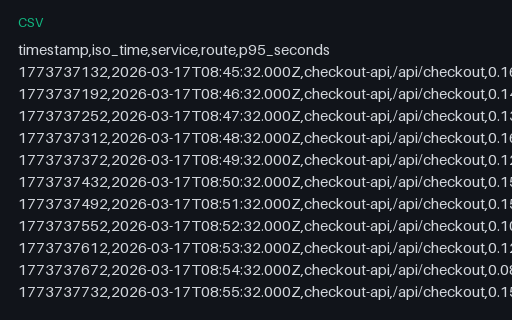
- csvMetric Range Export — Long (Tidy) CSV (csv)The same 90 samples as the query_range response, exported one row per observation with both epoch and ISO 8601 timestamps. The long layout every dataframe library prefers, and half of a reshaping pair.
- csvMetric Range Export — Wide (Pivoted) CSV (csv)The same 90 samples pivoted to one column per service and one row per timestamp — the layout a spreadsheet chart expects. Paired with the long-format export so a reshape can be scored in both directions.
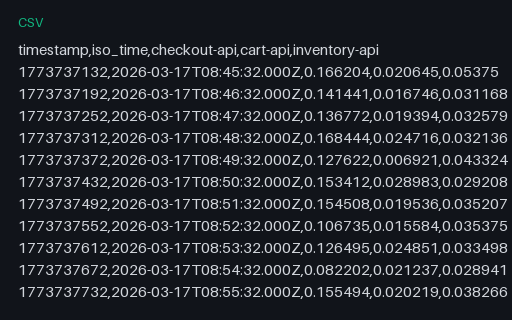
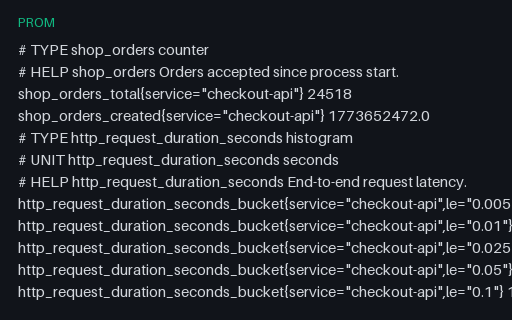
- promOpenMetrics — Full Document with UNIT, info and stateset (prom)A complete OpenMetrics document — the _total and _created series a counter really has, UNIT metadata, an info metric carrying build metadata and a stateset with exactly one active state — terminated by the mandatory # EOF. This is what the exposition format became once it was standardised.
Generated by generation/observability.py. Free for any use, no attribution required — license.