Skip to content
Novus Examples

Time-series datasets with known cadence

Sensor, market, event, and telemetry series with documented intervals, gaps, duplicates, and timezone behavior for testing importers, resampling, charts, and anomaly pipelines.

43 of 43 files
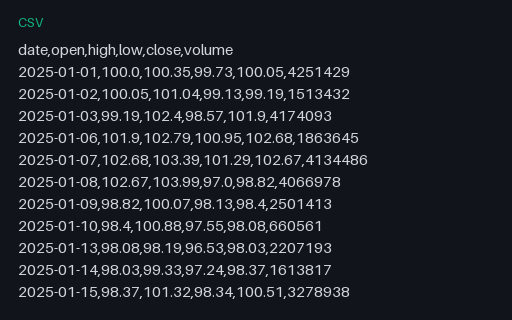
Preview of Stock OHLCV — Daily Candles (CSV, 252 rows)
csv
10.5 KB
Actual file preview for Stock OHLCV — Daily Candles (CSV, 252 rows)

Stock OHLCV — Daily Candles (CSV, 252 rows)

A year of daily OHLCV stock candles (open/high/low/close/volume) as a seeded random walk — a realistic finance time-series for testing charting, indicators, and importers. JSON twin included.

File
CSV · Finance · 252 rows
Use case
Data importTime-series data+1· Conversion set
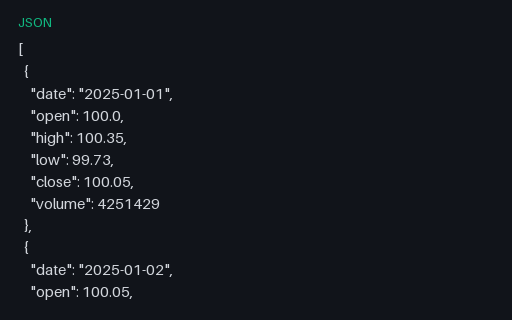
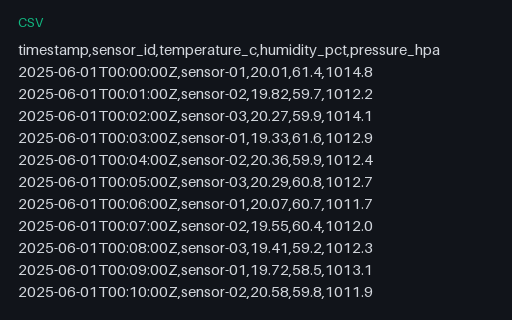
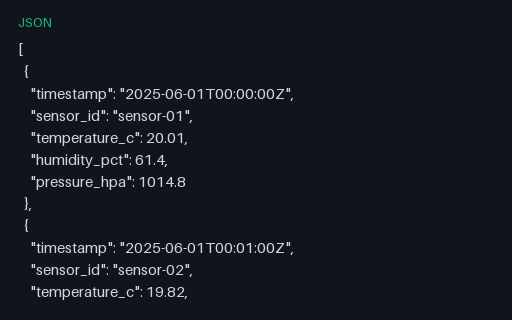
Preview of IoT Sensor Readings (CSV, 1440 rows)
csv
68.8 KB
Actual file preview for IoT Sensor Readings (CSV, 1440 rows)

IoT Sensor Readings (CSV, 1440 rows)

A day of IoT sensor readings (temperature, humidity, pressure) at one-minute intervals from three sensors, with a realistic daily cycle plus noise — for testing time-series ingestion and downsampling. JSON twin included.

File
CSV · Iot · 1,440 rows
Use case
Data importTime-series data+1· Conversion set
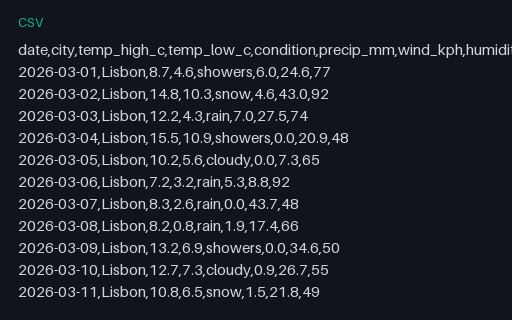
Preview of Weather Forecast — 30 days (CSV, 30 rows)
csv
1.5 KB
Actual file preview for Weather Forecast — 30 days (CSV, 30 rows)

Weather Forecast — 30 days (CSV, 30 rows)

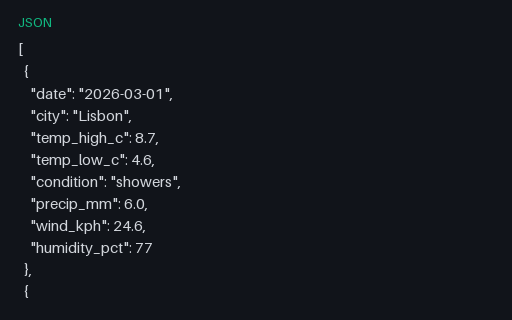
A 30-day daily weather forecast for one city — high/low temperature, condition, precipitation, wind, and humidity. Synthetic (seeded) data for testing weather widgets, chart tools, and time-series import.

File
CSV · Weather · 30 rows
Use case
Data importTime-series data+1· Conversion set
Preview of ROC Curve Points (CSV)
csv
179 B
Actual file preview for ROC Curve Points (CSV)

ROC Curve Points (CSV)

An ROC curve as CSV — decision threshold with the corresponding false-positive and true-positive rates, monotonic from (0,0) to (1,1). A fixture for testing chart tools and AUC calculators.

File
CSV · Eval
Preview of Flaky Detection — 40-Build Test-Run History (JSONL)
jsonl
44.6 KB
Actual file preview for Flaky Detection — 40-Build Test-Run History (JSONL)

Flaky Detection — 40-Build Test-Run History (JSONL)

Forty builds of six tests, one JSON object per line, with three tests that fail intermittently and three that never do. This is the input shape a flake detector ingests; the CSV twin in this group holds the aggregate it should produce.

File
JSONL · Flaky Runs · 240 records
Use case
JSON parsingTime-series data+1· Conversion set
Preview of Flaky Detection — Per-Test Failure-Rate Summary (CSV)
csv
420 B
Actual file preview for Flaky Detection — Per-Test Failure-Rate Summary (CSV)

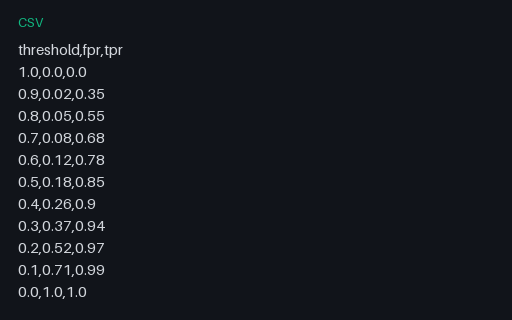
Flaky Detection — Per-Test Failure-Rate Summary (CSV)

The aggregate answer key for the 40-build history in this group: runs, passes, failures and failure rate per test, with each test labelled stable or flaky. Use it to score a detector rather than eyeballing 240 JSONL records.

File
CSV · Flaky Runs · 6 rows
Use case
CSV parsingConversion testing+1· Conversion set
Preview of Load Test — Per-Request Log (CSV)
csv
23.4 KB
Actual file preview for Load Test — Per-Request Log (CSV)

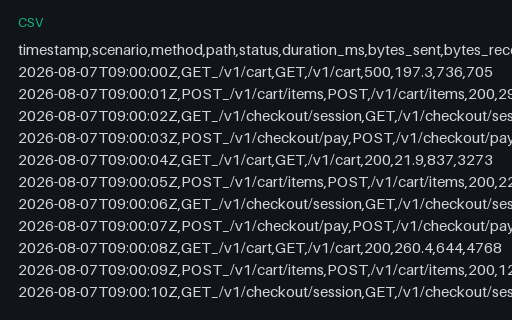
Load Test — Per-Request Log (CSV)

Three hundred individual request records with timestamp, scenario, status and duration — the raw log a percentile calculation has to be computed from rather than read off. A handful of 4xx and 5xx responses are mixed in so an error-rate calculation has something to find.

File
CSV · Performance · 300 rows
Use case
Performance testingCSV parsing+1· Conversion set
Preview of Prometheus Exposition — Counters and Gauges (prom)
prom
2.9 KB
Actual file preview for Prometheus Exposition — Counters and Gauges (prom)

Prometheus Exposition — Counters and Gauges (prom)

The body a /metrics endpoint returns: five metric families with HELP and TYPE metadata across 27 labelled series — request counters by route and status, process and runtime gauges, per-target up values (one deliberately 0) and a business gauge. The baseline exposition-parser fixture.

File
PROM · Metrics
Use case
ObservabilityTime-series data+1· Conversion set
Preview of Prometheus Exposition — Cumulative Histogram (prom)
prom
1.1 KB
Actual file preview for Prometheus Exposition — Cumulative Histogram (prom)

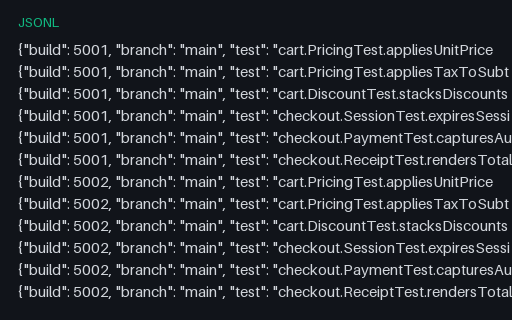
Prometheus Exposition — Cumulative Histogram (prom)

A classic Prometheus histogram: eleven finite le buckets plus +Inf, with monotonically non-decreasing cumulative counts and matching _sum and _count series. The fixture for bucket ordering, cumulative arithmetic and histogram_quantile interpolation.

File
PROM · Metrics
Use case
ObservabilityTime-series data+1· Conversion set
Preview of Prometheus Exposition — Summary with and without Quantiles (prom)
prom
700 B
Actual file preview for Prometheus Exposition — Summary with and without Quantiles (prom)

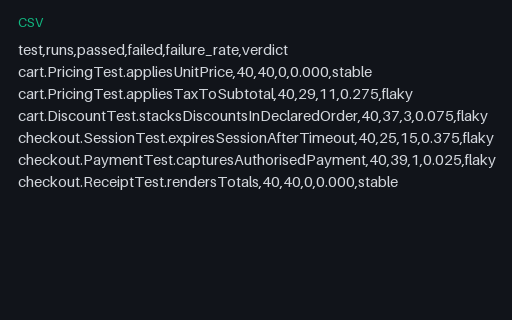
Prometheus Exposition — Summary with and without Quantiles (prom)

Two summary families — one exposing four client-side quantiles including quantile="1" for the observed maximum, and one exposing only _sum and _count, which is legal and common. Summaries cannot be re-aggregated across instances, and this fixture is where that gets tested.

File
PROM · Metrics
Use case
ObservabilityTime-series data+1· Conversion set
Preview of Prometheus Exposition — NaN, Infinities and Float Limits (prom)
prom
701 B
Actual file preview for Prometheus Exposition — NaN, Infinities and Float Limits (prom)

Prometheus Exposition — NaN, Infinities and Float Limits (prom)

Every numeric form the exposition format permits: NaN, +Inf and -Inf, negative zero, denormal and maximum doubles, and a uint64 counter beyond the exact range of a double. Parsers that route values through a JSON number or a 32-bit float fail on this file specifically.

File
PROM · Metrics
Use case
ObservabilityTime-series data+1· Conversion set
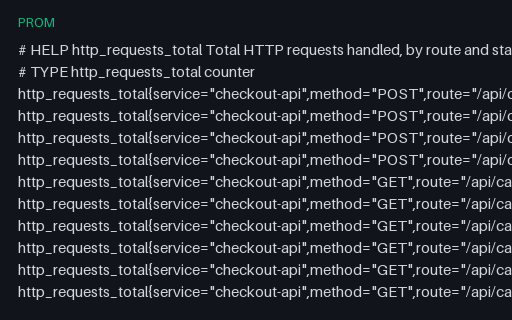
Preview of Prometheus Exposition — Explicit and Skewed Timestamps (prom)
prom
884 B
Actual file preview for Prometheus Exposition — Explicit and Skewed Timestamps (prom)

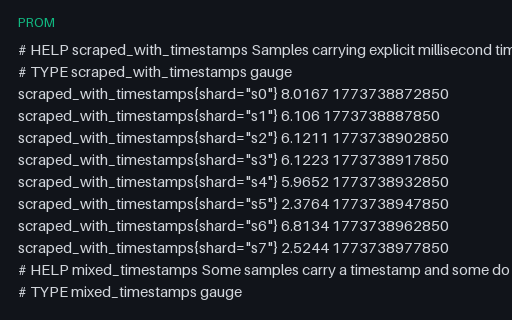
Prometheus Exposition — Explicit and Skewed Timestamps (prom)

Samples with explicit millisecond timestamps alongside samples without any, including one an hour stale and one an hour in the future. Optional timestamps are the part of the exposition format most parsers get wrong, and out-of-window samples are what a scraper must reject rather than backfill.

File
PROM · Metrics
Use case
ObservabilityTime-series data+1· Conversion set
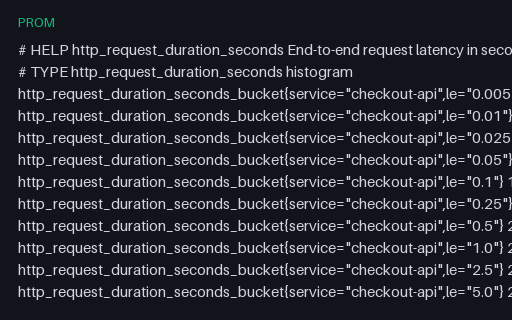
Preview of Prometheus Exposition — 2,000-Series Cardinality Explosion (prom)
prom
299.8 KB
Actual file preview for Prometheus Exposition — 2,000-Series Cardinality Explosion (prom)

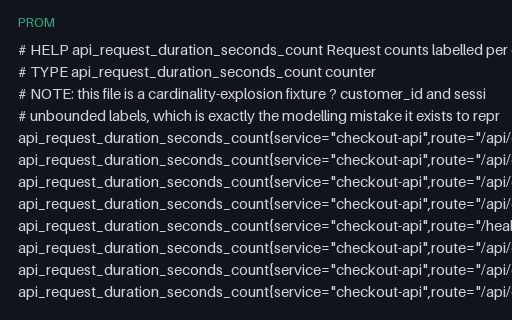
Prometheus Exposition — 2,000-Series Cardinality Explosion (prom)

A single metric family blown up to 2,000 series by two unbounded labels — customer_id and session_id — which is the most common way a metrics bill and a TSDB both fall over. A load fixture for scrape parsing and a worked example for cardinality-limit rules.

File
PROM · Metrics
Preview of Prometheus Textfile Collector — Batch Job Metrics (prom)
prom
793 B
Actual file preview for Prometheus Textfile Collector — Batch Job Metrics (prom)

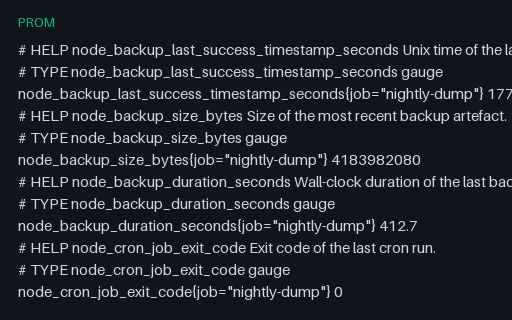
Prometheus Textfile Collector — Batch Job Metrics (prom)

The file a cron job drops into the node_exporter textfile directory so a batch task can be monitored without a scrape endpoint: last-success timestamp, artefact size, duration and per-job exit codes, one of which is non-zero. The canonical shape for batch-job alerting.

File
PROM · Metrics
Use case
ObservabilityTime-series data+1· Conversion set
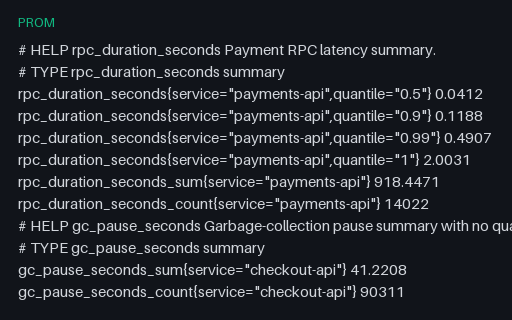
Preview of OpenMetrics — Full Document with UNIT, info and stateset (prom)
prom
2.1 KB
Actual file preview for OpenMetrics — Full Document with UNIT, info and stateset (prom)

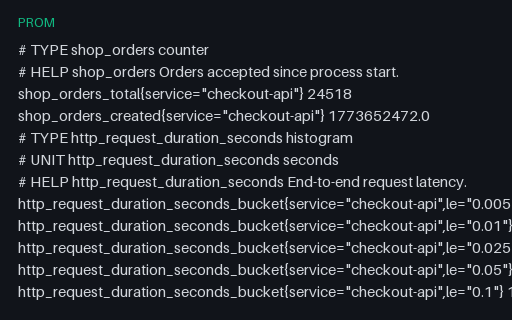
OpenMetrics — Full Document with UNIT, info and stateset (prom)

A complete OpenMetrics document — the _total and _created series a counter really has, UNIT metadata, an info metric carrying build metadata and a stateset with exactly one active state — terminated by the mandatory # EOF. This is what the exposition format became once it was standardised.

File
PROM · Metrics
Use case
ObservabilityTime-series data+1· Conversion set
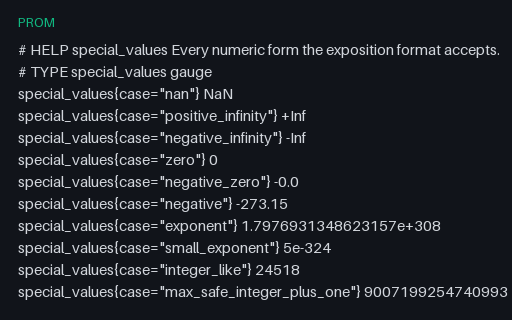
Preview of OpenMetrics — Histogram Exemplars Linking to the Trace Fixtures (prom)
prom
1.7 KB
Actual file preview for OpenMetrics — Histogram Exemplars Linking to the Trace Fixtures (prom)

OpenMetrics — Histogram Exemplars Linking to the Trace Fixtures (prom)

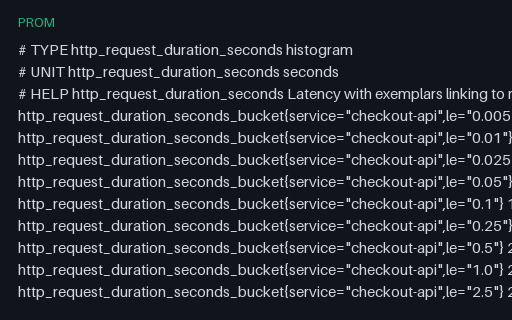
Histogram buckets carrying exemplars whose trace_id and span_id resolve against the OTLP trace fixtures in this category — the exact-to-example link that turns a latency spike on a graph into a specific request. Five exemplars, each with its own observed value and timestamp.

File
PROM · Metrics
Use case
ObservabilityTime-series data+1· Conversion set
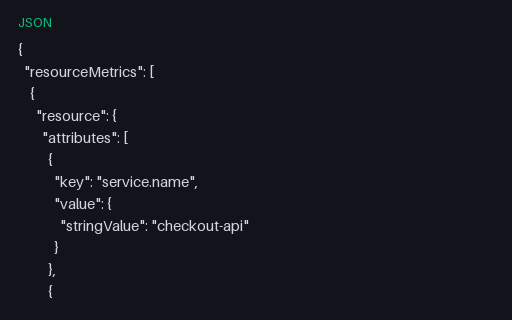
Preview of OTLP Metrics — Monotonic Sum and Gauge Data Points (json)
json
6.6 KB
Actual file preview for OTLP Metrics — Monotonic Sum and Gauge Data Points (json)

OTLP Metrics — Monotonic Sum and Gauge Data Points (json)

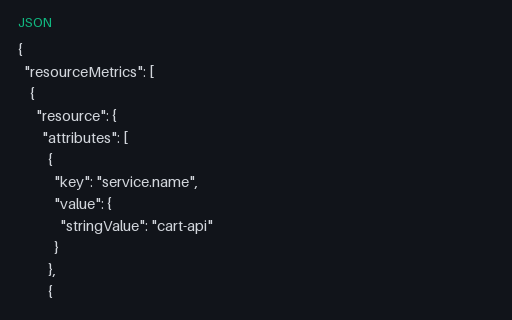
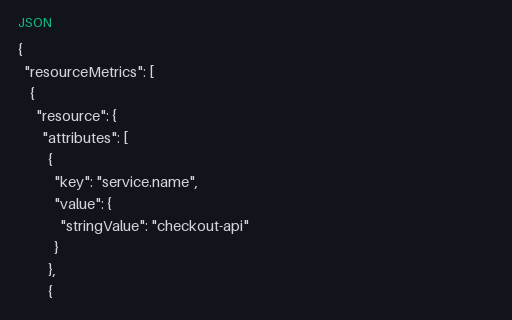
An OTLP metrics export with a monotonic cumulative sum and two gauges, showing the parts of the wire format that trip parsers: int data points serialised as JSON strings, UCUM unit annotations like {request} and By, and the start timestamp that makes a counter reset detectable.

File
JSON · Metrics
Use case
ObservabilityJSON parsing+1· Conversion set
Preview of OTLP Metrics — Cumulative Temporality (json)
json
3.5 KB
Actual file preview for OTLP Metrics — Cumulative Temporality (json)

OTLP Metrics — Cumulative Temporality (json)

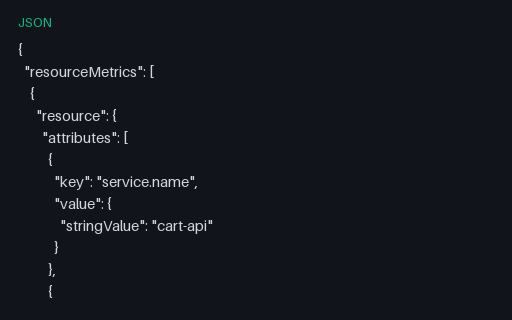
Cumulative sums whose start timestamp stays fixed across exports, so every point is the running total since process start. Paired with a delta-temporality twin covering the same window, because converting between the two is a stateful operation that a bridge must get right in both directions.

File
JSON · Metrics
Use case
ObservabilityTime-series data+1· Paired fixture
Preview of OTLP Metrics — Delta Temporality (json)
json
5.3 KB
Actual file preview for OTLP Metrics — Delta Temporality (json)

OTLP Metrics — Delta Temporality (json)

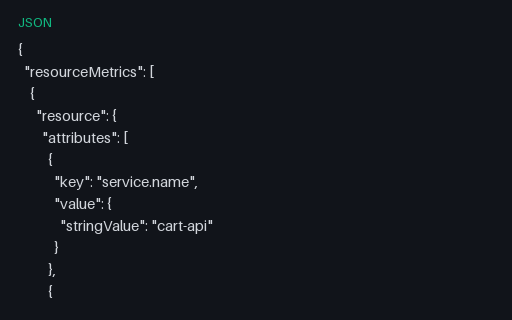
The same 24 hours of cart updates as six delta points, each with its own start and end timestamp covering a four-hour window. The delta twin of the cumulative fixture: summing these must reproduce the cumulative total exactly, and a gap or overlap in the windows is the failure to catch.

File
JSON · Metrics
Use case
ObservabilityTime-series data+1· Paired fixture
Preview of OTLP Metrics — Exemplars with Trace and Span IDs (json)
json
4.8 KB
Actual file preview for OTLP Metrics — Exemplars with Trace and Span IDs (json)

OTLP Metrics — Exemplars with Trace and Span IDs (json)

An OTLP histogram carrying two exemplars, each with the trace and span ID of a request that landed in that bucket — including the 2.0031-second outlier that corresponds to the failed payment in the error-trace fixture. The metrics-to-traces jump, with a resolvable target.

File
JSON · Metrics
Use case
ObservabilityJSON parsing+1· Conversion set
Preview of OTLP Metrics — Counter Reset on Process Restart (json)
json
5.3 KB
Actual file preview for OTLP Metrics — Counter Reset on Process Restart (json)

OTLP Metrics — Counter Reset on Process Restart (json)

A monotonic counter that drops from 94,880 to 1,120 when its process restarts, with startTimeUnixNano changing at exactly that point to mark the reset. Rate calculations that subtract consecutive values without checking the start timestamp produce a large negative rate here.

File
JSON · Metrics
Use case
ObservabilityTime-series data+1· Conversion set
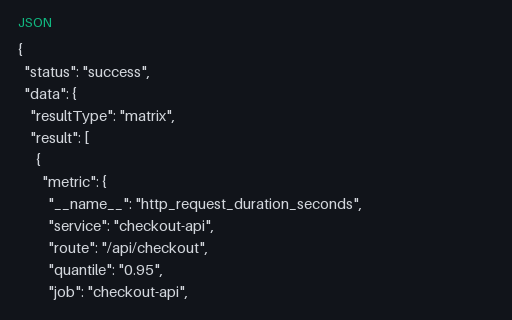
Preview of Prometheus HTTP API — query_range Matrix Response (json)
json
7.3 KB
Actual file preview for Prometheus HTTP API — query_range Matrix Response (json)

Prometheus HTTP API — query_range Matrix Response (json)

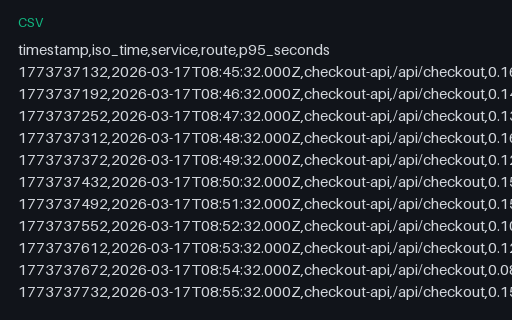
A Prometheus /api/v1/query_range response: three labelled series of 30 points each at a 60-second step, with sample values as JSON strings and timestamps as float seconds. The exact envelope a dashboard client has to unpack, including the string-typed values that break naive charting code.

File
JSON · Metrics
Use case
ObservabilityJSON parsing+1· Conversion set
Preview of Metric Range Export — Long (Tidy) CSV (csv)
csv
6.1 KB
Actual file preview for Metric Range Export — Long (Tidy) CSV (csv)

Metric Range Export — Long (Tidy) CSV (csv)

The same 90 samples as the query_range response, exported one row per observation with both epoch and ISO 8601 timestamps. The long layout every dataframe library prefers, and half of a reshaping pair.

File
CSV · Metrics · 90 rows
Use case
ObservabilityCSV parsing+1· Conversion set
Preview of Metric Range Export — Wide (Pivoted) CSV (csv)
csv
1.9 KB
Actual file preview for Metric Range Export — Wide (Pivoted) CSV (csv)

Metric Range Export — Wide (Pivoted) CSV (csv)

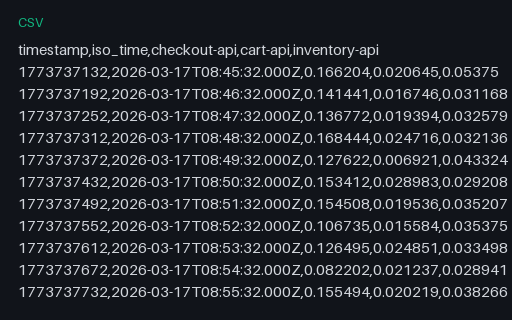
The same 90 samples pivoted to one column per service and one row per timestamp — the layout a spreadsheet chart expects. Paired with the long-format export so a reshape can be scored in both directions.

File
CSV · Metrics · 30 rows
Use case
ObservabilityCSV parsing+1· Conversion set
Preview of Prometheus Recording Rules — Layered Pre-Aggregations (yaml)
yaml
952 B
Actual file preview for Prometheus Recording Rules — Layered Pre-Aggregations (yaml)

Prometheus Recording Rules — Layered Pre-Aggregations (yaml)

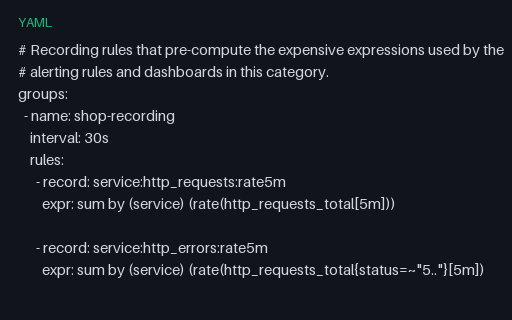
Five recording rules following the level:metric:operation naming convention, where one rule consumes two others recorded earlier in the same group — evaluation order inside a group is sequential, which is exactly what makes that legal and what a rule validator must understand.

File
YAML · Alerts
Use case
ObservabilityConfig parsing+1· Conversion set
Preview of SLO Error Budget — 28-Day Burndown Export (csv)
csv
2.2 KB
Actual file preview for SLO Error Budget — 28-Day Burndown Export (csv)

SLO Error Budget — 28-Day Burndown Export (csv)

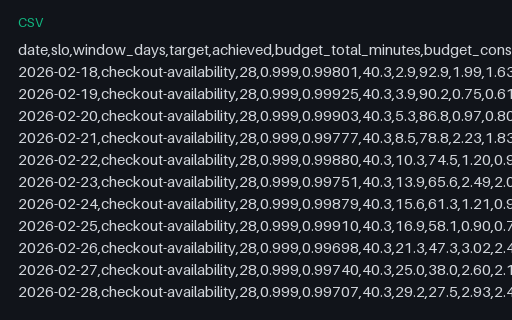
A day-by-day burndown of the availability SLO defined in the OpenSLO fixture: achieved ratio, budget consumed and remaining, and one-hour and six-hour burn rates. Consumption is monotonic across the window, which is the invariant a burn-rate chart must not violate.

File
CSV · Alerts · 28 rows
Use case
ObservabilityCSV parsing+1· Conversion set
Preview of GPX — Single-Segment Track (24 points)
gpx
3.4 KB
Actual file preview for GPX — Single-Segment Track (24 points)

GPX — Single-Segment Track (24 points)

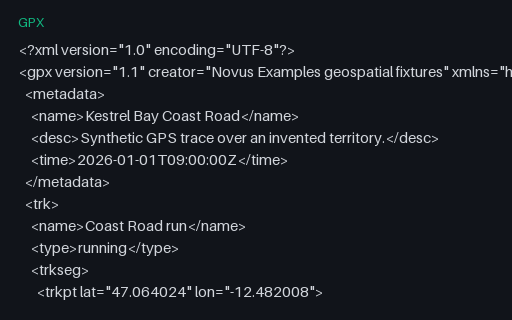
The baseline GPS trace for this category: 24 timestamped, elevated trackpoints in a single segment, walking the Coast Road of the invented territory. Every other GPX fixture here is this file with one thing changed.

File
GPX · Gpx · UTF-8
Use case
GeospatialTime-series data+1· Conversion set
Preview of GPX — Track Split Into Two Segments by a Pause
gpx
3.4 KB
Actual file preview for GPX — Track Split Into Two Segments by a Pause

GPX — Track Split Into Two Segments by a Pause

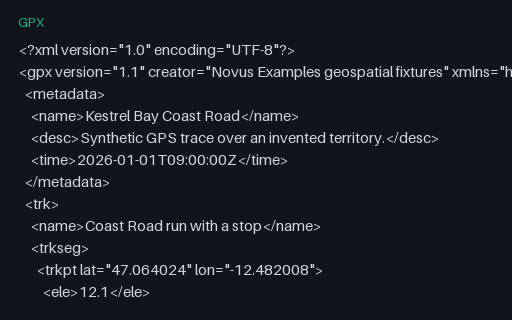
The same 24 points split into two `trkseg` elements with a ten-minute gap between them — what a receiver writes after a stop or a signal loss. Tools that concatenate segments without noticing the boundary report a moving average dragged down by a pause that never happened on the move.

File
GPX · Gpx · UTF-8
Use case
GeospatialTime-series data+1· Conversion set
Preview of GPX — Track Without Elevation
gpx
1.2 KB
Actual file preview for GPX — Track Without Elevation

GPX — Track Without Elevation

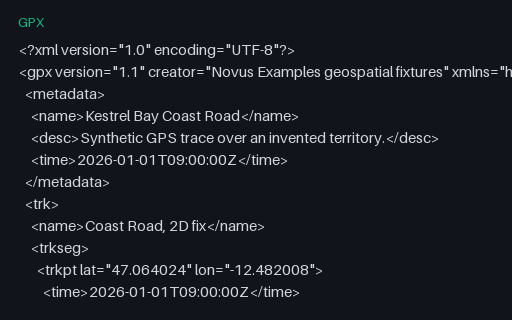
Eight trackpoints with timestamps but no `ele` element, the shape a receiver writes on a 2D fix. Elevation-profile code that assumes the element is present either crashes or charts a flat line at zero, which looks like real data.

File
GPX · Gpx · UTF-8
Use case
GeospatialError handling+1· Conversion set
Preview of GPX — Track Without Timestamps
gpx
1.1 KB
Actual file preview for GPX — Track Without Timestamps

GPX — Track Without Timestamps

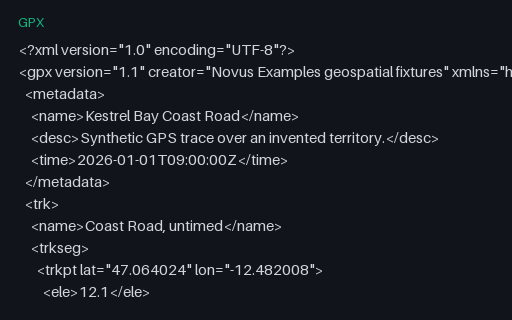
The same eight points with elevation but no `time` element — what you get when a track is drawn in a planning tool rather than recorded. Speed and pace calculations must refuse to produce a number here instead of dividing by a zero duration.

File
GPX · Gpx · UTF-8
Use case
GeospatialError handling+1· Conversion set
Preview of GPX — Garmin TrackPointExtension (heart rate, cadence, temperature)
gpx
3.9 KB
Actual file preview for GPX — Garmin TrackPointExtension (heart rate, cadence, temperature)

GPX — Garmin TrackPointExtension (heart rate, cadence, temperature)

Eight trackpoints each carrying a Garmin TrackPointExtension with heart rate, cadence and air temperature. The GPX schema deliberately leaves `extensions` open, so this is the fixture for checking that a reader surfaces vendor data instead of discarding it on export.

File
GPX · Gpx · UTF-8
Use case
GeospatialMetadata testing+1· Conversion set
Preview of GPX — Timestamps With a UTC Offset Instead of Z
gpx
1.4 KB
Actual file preview for GPX — Timestamps With a UTC Offset Instead of Z

GPX — Timestamps With a UTC Offset Instead of Z

The same eight points timestamped with a +01:00 offset rather than the usual Z. The digits are identical to the reference track, so a parser that strips the offset and assumes UTC produces times that are wrong by exactly one hour — a silent error that only shows up when two traces are merged.

File
GPX · Gpx · UTF-8
Use case
GeospatialTime-series data+1· Conversion set
Preview of GPX — Track With a Single Trackpoint
gpx
523 B
Actual file preview for GPX — Track With a Single Trackpoint

GPX — Track With a Single Trackpoint

A track containing exactly one point, which is what a receiver writes when a recording is stopped immediately. Distance, speed and bearing all need a pair of points, so this is the fixture that finds off-by-one loops and empty-slice crashes.

File
GPX · Gpx · UTF-8
Use case
GeospatialError handling+1· Conversion set
Preview of GPX — Out-of-Order and Duplicated Timestamps
gpx
1.3 KB
Actual file preview for GPX — Out-of-Order and Duplicated Timestamps

GPX — Out-of-Order and Duplicated Timestamps

Seven trackpoints whose timestamps go forwards, backwards, and then repeat — the pattern a receiver produces after a clock correction or a buffered replay. Naive speed calculations divide by a negative or zero time delta and emit impossible values.

File
GPX · Gpx · UTF-8
Use case
GeospatialError handling+1· Conversion set
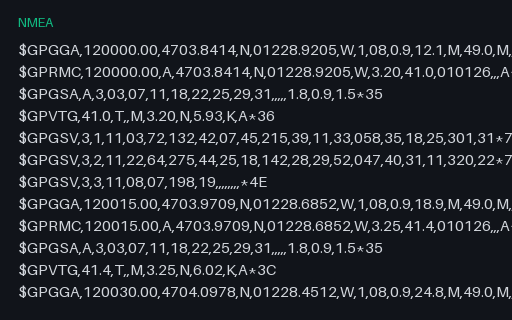
Preview of NMEA 0183 — Mixed GGA/RMC/GSA/GSV/VTG Log
nmea
3.2 KB
Actual file preview for NMEA 0183 — Mixed GGA/RMC/GSA/GSV/VTG Log

NMEA 0183 — Mixed GGA/RMC/GSA/GSV/VTG Log

A twelve-fix receiver log with the five sentence types a GPS unit normally interleaves, including three-part GSV satellite-in-view sets. Every checksum is correct, so a parser that verifies them should accept the whole file.

File
NMEA · Nmea · ASCII
Use case
GeospatialTime-series data+1· Conversion set
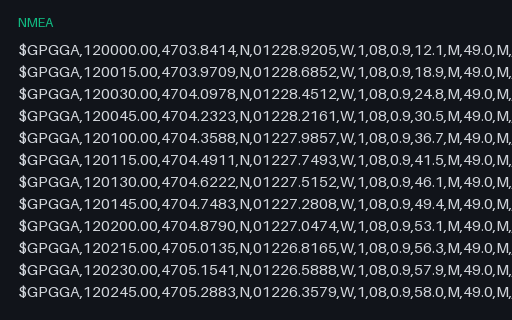
Preview of NMEA 0183 — GGA Sentences Only
nmea
852 B
Actual file preview for NMEA 0183 — GGA Sentences Only

NMEA 0183 — GGA Sentences Only

The same twelve fixes reduced to GGA alone. GGA carries time-of-day but no date and no speed, so a parser that only reads GGA cannot place the track on a calendar — a real limitation that this file makes obvious rather than leaving to be discovered later.

File
NMEA · Nmea · ASCII
Use case
GeospatialTime-series data+1· Conversion set
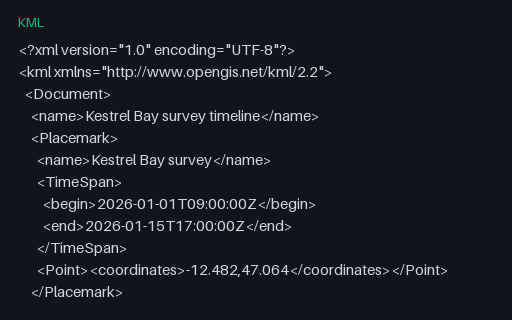
Preview of KML — TimeSpan and TimeStamp Time Primitives
kml
1.3 KB
Actual file preview for KML — TimeSpan and TimeStamp Time Primitives

KML — TimeSpan and TimeStamp Time Primitives

Four Placemarks with a `TimeSpan` and one with an instantaneous `TimeStamp`, which is what drives the time slider in a globe viewer. Time is the first thing a KML-to-GeoJSON conversion drops, because RFC 7946 has no place to put it.

File
KML · Kml · UTF-8
Use case
GeospatialMetadata testing+1· Conversion set
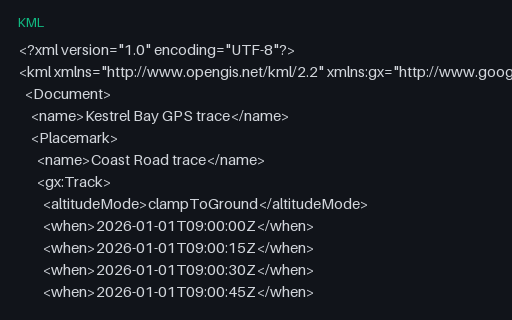
Preview of KML — Google gx:Track Extension (time-stamped positions)
kml
1.3 KB
Actual file preview for KML — Google gx:Track Extension (time-stamped positions)

KML — Google gx:Track Extension (time-stamped positions)

A `gx:Track` from the Google KML extension: ten `when` timestamps followed by ten `gx:coord` positions, paired by index rather than nested. Note the coordinates are space-separated here even though core KML uses commas — a detail that breaks parsers reusing the same splitting code.

File
KML · Kml · UTF-8
Use case
GeospatialTime-series data+1· Conversion set
Preview of NumPy .npy — datetime64 Seconds Since the Epoch (.npy)
npy
168 B
Actual file preview for NumPy .npy — datetime64 Seconds Since the Epoch (.npy)

NumPy .npy — datetime64 Seconds Since the Epoch (.npy)

Five timestamps stored as datetime64 with second resolution, where the unit is part of the dtype descriptor and the values on disk are plain int64 epoch seconds. Dropping the unit turns 2026-01-01 into the integer 1767225600 without any complaint.

File
NPY · Arrays
Use case
Scientific dataSerialization testing+1· Conversion set
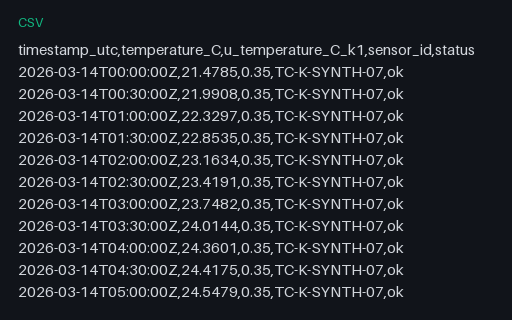
Preview of Thermocouple Time Series With Standard Uncertainty (.csv)
csv
2.5 KB
Actual file preview for Thermocouple Time Series With Standard Uncertainty (.csv)

Thermocouple Time Series With Standard Uncertainty (.csv)

A full day of thermocouple readings at 30-minute cadence with a constant type-B standard uncertainty and two rows flagged as recovering. The timestamps are explicit UTC with a Z suffix so a reader has no excuse to guess a timezone.
File
CSV · Measurements · 48 rows
Use case
Scientific dataCSV parsing+2· Conversion set