
ROC Curve Points (CSV)
An ROC curve as CSV — decision threshold with the corresponding false-positive and true-positive rates, monotonic from (0,0) to (1,1). A fixture for testing chart tools and AUC calculators.
threshold,fpr,tpr
1.0,0.0,0.0
0.9,0.02,0.35
0.8,0.05,0.55
0.7,0.08,0.68
0.6,0.12,0.78
0.5,0.18,0.85
0.4,0.26,0.9
0.3,0.37,0.94
0.2,0.52,0.97
0.1,0.71,0.99
0.0,1.0,1.0
Specifications
- Points
- 11
- Schema
- threshold, fpr, tpr
- Auc
- ≈0.93
What is a .csv file?
CSV (Comma-Separated Values) is a plain-text tabular format where rows are lines and fields are separated by commas, with quoting rules for values that contain delimiters, quotes, or newlines. It has no formal type system and depends on encoding and dialect conventions. It is the most portable format for tabular data exchange.
How to use this file
Use an example CSV to test parsers against quoting and embedded-delimiter edge cases, header handling, encoding detection, and import pipelines into databases or spreadsheets.
How to use this file for testing
“ROC Curve Points (CSV)” is a deterministic Novus Examples fixture for Model evaluation, CSV parsing, Time-series data. Benchmark results, confusion matrices, ROC curves, and classification reports in CSV and JSON — for testing eval dashboards, metric parsers, and leaderboard importers.
Documented properties for this file: schema: threshold, fpr, tpr. Compare results against paired or grouped companions on this page when present (clean↔damaged, searchable↔scanned, or format twins) so scores stay reproducible across runs.
Download the file once, keep the path stable in CI or local scripts, and treat the spec table as the contract: dimensions, seeds, field lists, and roles are intentional. Corrupt or invalid samples are labelled as such — expect parsers to fail loudly rather than silently accept them.
AI/ML fixtures are fully synthetic with documented schemas — no real people or data. Test data loaders, tokenizers, annotation converters, embedding/vector stores, or eval-metric parsers against the known structure and fixed seeds.
Code examples
import pandas as pd

df = pd.read_csv("roc-curve.csv")
print(df.head())
print(df.dtypes)
Related files
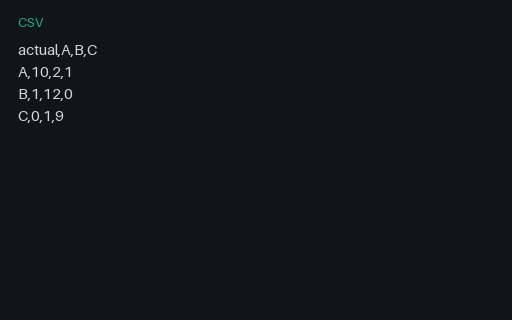
- csvConfusion Matrix — 3 Classes (CSV)3×3 confusion matrix CSV for classification metric calculators.
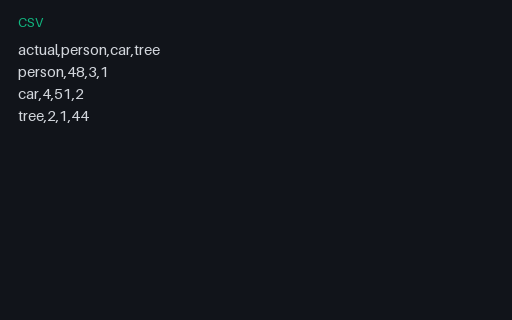
- csvConfusion Matrix — 3-class (CSV)A 3-class confusion matrix as CSV — rows are the true class, columns the predicted class, cells the counts. Paired with a JSON twin for testing metric parsers and evaluation visualisers.
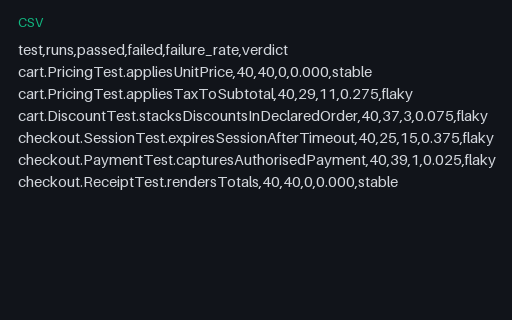
- csvFlaky Detection — Per-Test Failure-Rate Summary (CSV)The aggregate answer key for the 40-build history in this group: runs, passes, failures and failure rate per test, with each test labelled stable or flaky. Use it to score a detector rather than eyeballing 240 JSONL records.
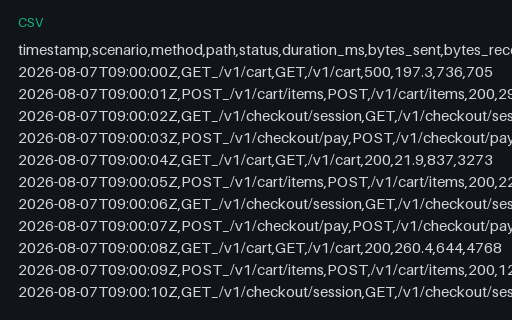
- csvLoad Test — Per-Request Log (CSV)Three hundred individual request records with timestamp, scenario, status and duration — the raw log a percentile calculation has to be computed from rather than read off. A handful of 4xx and 5xx responses are mixed in so an error-rate calculation has something to find.
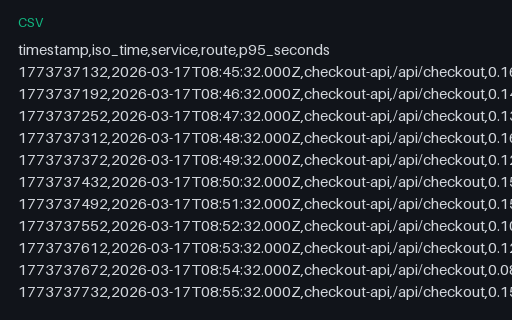
- csvMetric Range Export — Long (Tidy) CSV (csv)The same 90 samples as the query_range response, exported one row per observation with both epoch and ISO 8601 timestamps. The long layout every dataframe library prefers, and half of a reshaping pair.
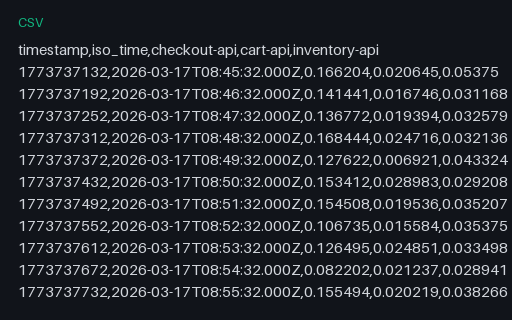
- csvMetric Range Export — Wide (Pivoted) CSV (csv)The same 90 samples pivoted to one column per service and one row per timestamp — the layout a spreadsheet chart expects. Paired with the long-format export so a reshape can be scored in both directions.
Generated by generation/ai_datasets.py. Free for any use, no attribution required — license.