Test tooling spends most of its life reading other tools' output, and that output is exactly what nobody publishes a sample of. This category ships the report formats a CI dashboard, a coverage gate, or a flaky-test detector has to parse: JUnit and NUnit XML, MSTest TRX, TAP streams, Cucumber and Playwright JSON, Gherkin feature files, and Robot Framework suites. Coverage arrives as Cobertura, JaCoCo and Clover XML alongside LCOV tracefiles and Istanbul JSON, with matching totals across formats so a converter can be diffed against a known answer. Performance and network fixtures round it out — HAR captures, load-test summaries, and timing tables. Passing, failing, skipped, and intentionally malformed reports are all labelled, so a parser can be held to the difference.
One step of one scenario fails with an assertion message and a stack frame; every other step passes. In cucumber.json a scenario has no status of its own — it is failed if any of its steps is — so this file catches reporters that look for a scenario-level field that does not exist.
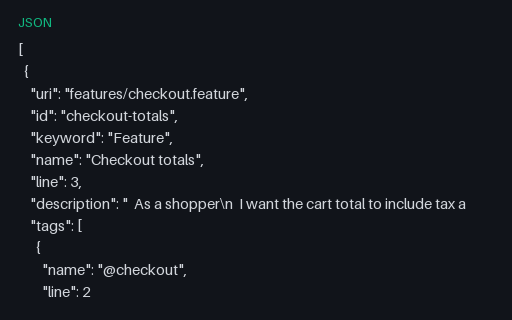
The legacy cucumber.json report for the same run — the format nearly every BDD dashboard still ingests. Durations are in nanoseconds here and in a nested {seconds, nanos} object in the messages twin, which is the single most common unit bug when converting between the two.
The three non-failure statuses BDD runners produce and dashboards routinely collapse into "failed": undefined (no step definition matched), pending (explicitly unimplemented) and skipped (never attempted). Whether the run is red depends on the runner's strict setting, which is exactly the decision this file forces.
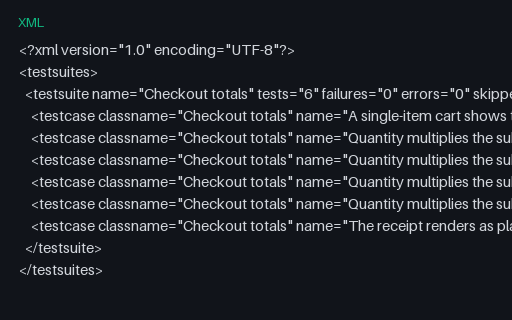
The same six pickles reported as JUnit XML, which is what a BDD suite hands to a generic CI dashboard. One <testcase> per pickle means the three expanded outline rows appear as three tests with identical names — enough to break any store keyed on name alone.
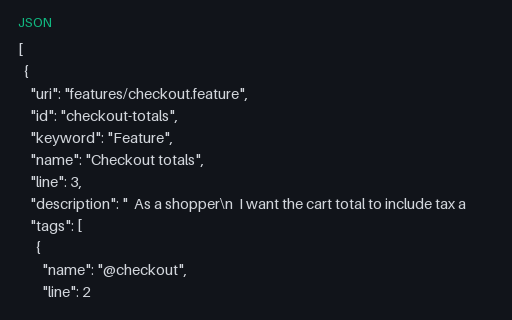
The messages twin of the failing run: one testStepFinished carries status FAILED with both a human message and a structured exception object, and testRunFinished reports success false. Comparing it with the passing stream in the other group isolates exactly which envelopes a failure changes.
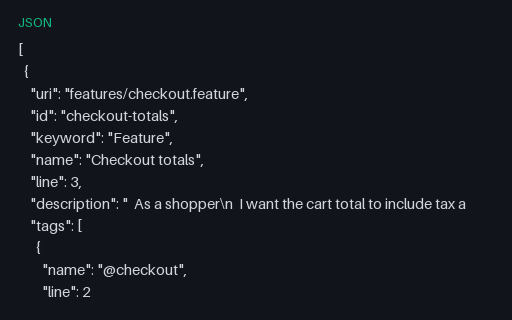
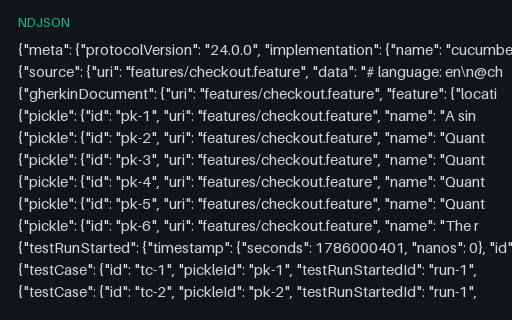
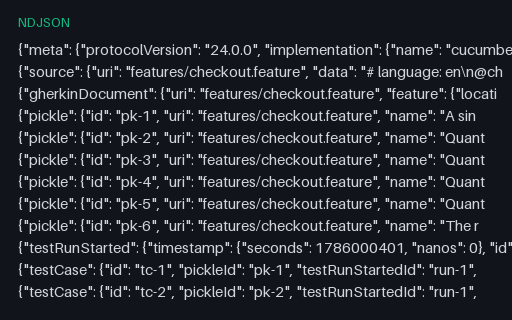
The machine twin of checkout.feature: the cucumber-messages envelope stream a runner emits, with meta, source, gherkinDocument, one pickle per expanded scenario, and paired testStepStarted/testStepFinished envelopes carrying nanosecond durations. Written as NDJSON because that is the format's actual wire shape — one envelope per line, not a JSON array.
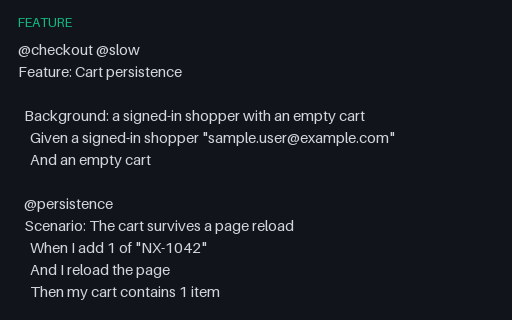
A named Background whose two steps are prepended to all three scenarios, plus feature-level tags that every scenario inherits and scenario-level tags that only some carry. Tag filtering is where this file earns its keep: @slow selects one scenario by its own tag and all three by inheritance from the feature.
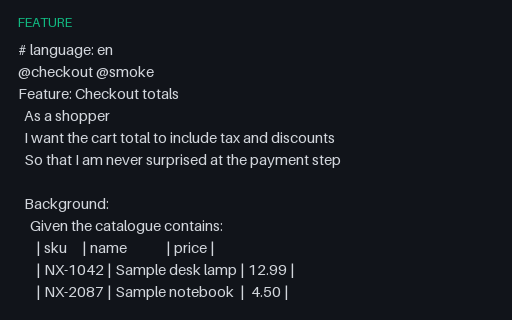
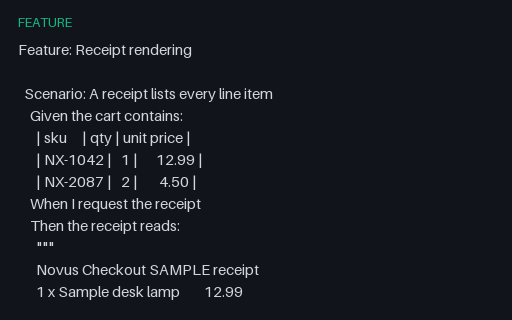
The source feature for this whole group: a Background with a data table, a plain scenario, a Scenario Outline expanded by two Examples tables, and a scenario asserting against a doc string. It compiles to exactly six pickles and 32 pickle steps — the numbers the cucumber-messages and cucumber.json twins next to it report.
A step argument table with a header row, followed by two doc strings — one plain and one carrying a json content type after the opening delimiter. Doc string indentation is relative to the delimiter, so the receipt body must keep its internal column alignment while losing the six leading spaces.
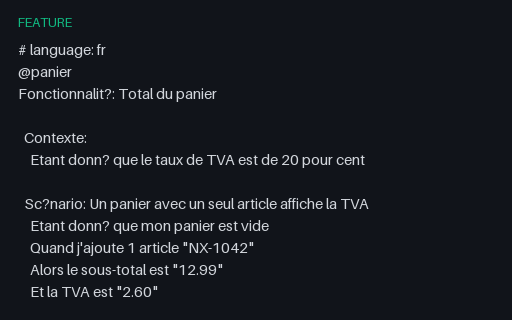
A feature written entirely in French keywords, declared by the # language: fr header that must be the first line of the file. Parsers that hardcode English keywords read this as a feature with no scenarios rather than reporting an error, so it fails silently.
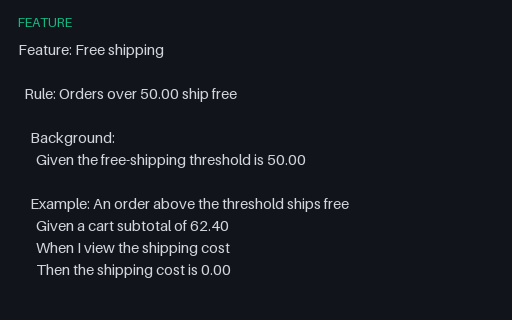
Two Rule blocks, the first with its own Background that applies only to the examples inside it. Parsers written before Gherkin 6 either reject Rule outright or, worse, hoist the Background to the whole feature and add a step to the third example that was never there.
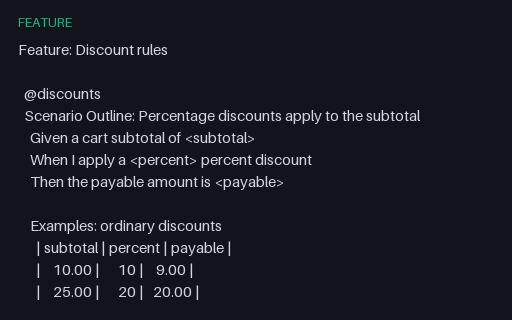
One outline expanded by two separate Examples tables, the second of which carries its own @edge tag. Expansion must produce five scenarios, and only the two from the tagged table may match a run filtered on @edge — a distinction parsers that flatten the tables lose.
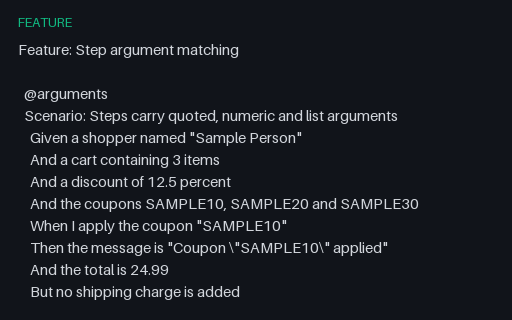
Steps exercising every argument shape a step-definition matcher has to handle: quoted strings with escaped inner quotes, integers, decimals, a comma-and-and list, the But keyword, and angle brackets in a plain Scenario where they are literal text rather than outline placeholders.
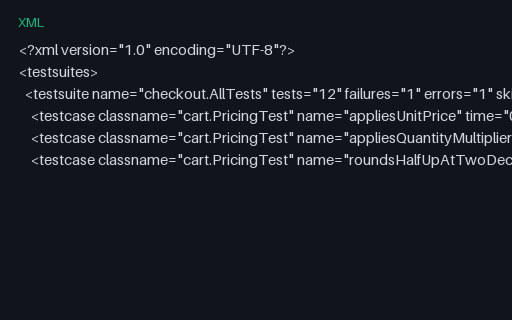
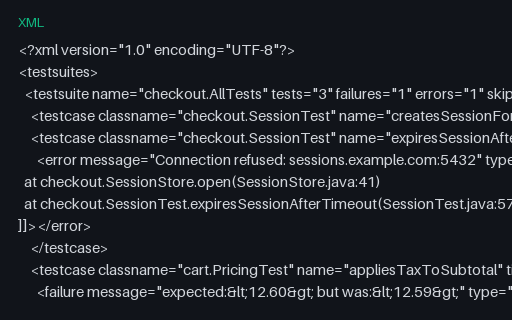
An intentionally corrupt JUnit report: the file ends in the middle of a testcase attribute value, exactly as it would if the CI worker were killed while the reporter was still writing. Three elements are left unclosed and the document is not well-formed XML. A parser must fail loudly rather than report the two complete cases as the whole run.
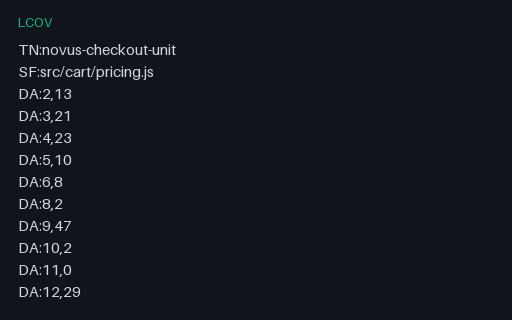
An intentionally corrupt LCOV tracefile: every record declares LH eight greater than LF, so more lines were hit than exist. The syntax is perfectly valid, which is the point — the contradiction is semantic, and a coverage gate that trusts the summary counters computes over 100% coverage and passes a build it should have stopped. Recompute LH from the DA lines and the real figure is 127/140.
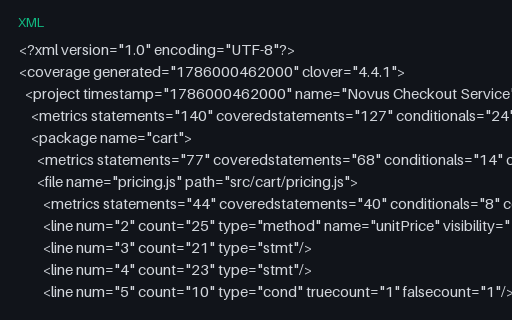
The Clover serialisation, whose <metrics> element rolls statements, conditionals and methods into a single elements/coveredelements pair. Anything reading only that pair reports a blended percentage that matches none of the other three formats unless the components are separated first. Every file in this group describes the same four-file source tree and reports 127/140 lines, 17/24 branch outcomes and 18/20 functions, so a converter can be diffed against a known answer.
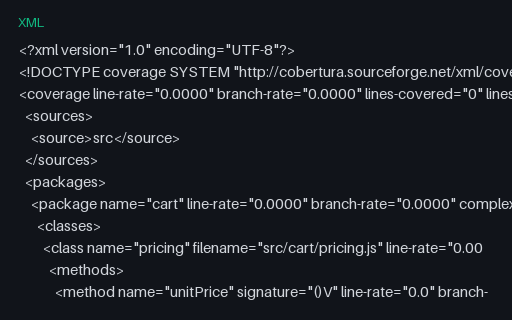
A structurally complete Cobertura report in which line-rate and branch-rate are 0.0 everywhere. The counterpart to the zero-coverage LCOV file, for checking that a converter keeps the class and method structure when there is nothing covered to describe.
Cobertura with a condition-coverage attribute on every branching line, written in the "50% (1/2)" form. The percentage and the fraction can disagree in real reports, so a parser should read the fraction and treat the percentage as derived.
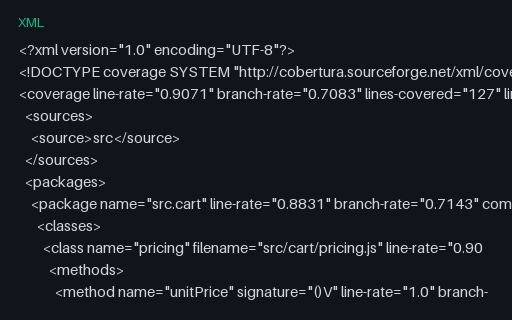
The same coverage split into one package per source directory with dotted names, the layout a JVM project produces. Reports that key on class name alone collide as soon as two packages hold a class of the same name, which this file is shaped to expose.
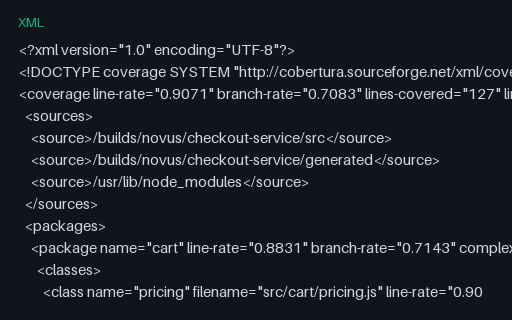
Three <source> roots with class filenames given relative to them, which is how Cobertura represents a multi-root project. A viewer must try each root in turn to resolve a file; one that assumes a single root shows "source not found" for most of the report.
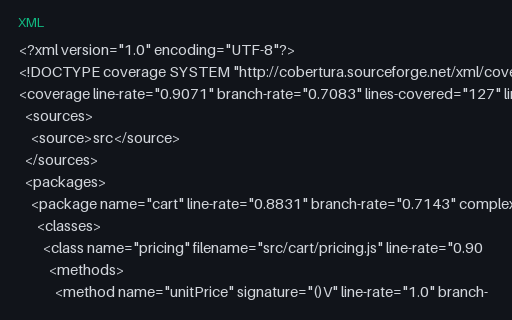
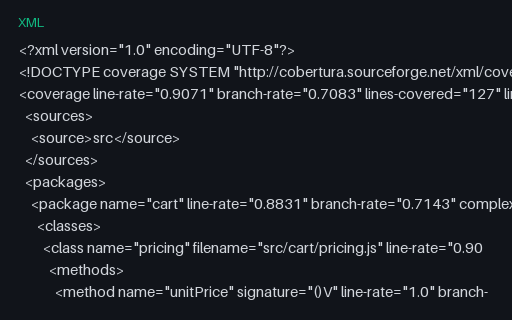
The Cobertura serialisation of the same run, with packages, classes, per-method line rates and condition-coverage attributes on every branching line. Cobertura expresses coverage as rates rather than counts, so this is the file that catches converters rounding a percentage into a hit count. Every file in this group describes the same four-file source tree and reports 127/140 lines, 17/24 branch outcomes and 18/20 functions, so a converter can be diffed against a known answer.
A tracefile sitting misses the gate by one line against the 80% minimum in this group's gate config: 111 of 140 lines, 79.29%. 79.29% is one covered line short of the gate, the smallest possible failure.
A tracefile sitting meets the gate exactly against the 80% minimum in this group's gate config: 112 of 140 lines, 80.00%. 80.00% is exactly the configured minimum, so a > comparison fails the build and a >= comparison passes it — the single most common off-by-one in a coverage gate.
A tracefile sitting clears the gate by one line against the 80% minimum in this group's gate config: 113 of 140 lines, 80.71%. 80.71% clears the gate by one covered line, the smallest possible pass.
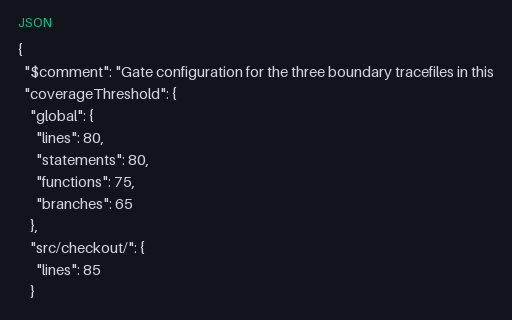
The threshold configuration the three boundary tracefiles in this group are meant to be judged against: global minimums, one per-path override and an explicit >= comparison. Publishing the comparison operator is the point — leaving it implicit is what makes an at-the-gate report ambiguous.
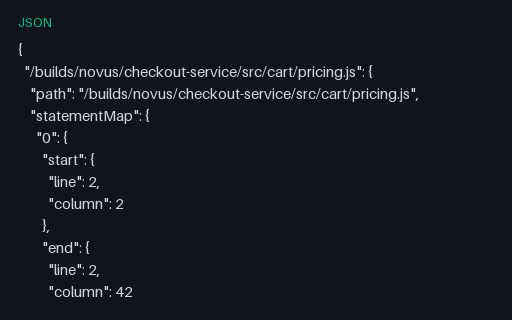
The raw Istanbul document nyc and Jest write before any reporter runs: statementMap, fnMap and branchMap giving source locations, with the s, f and b objects holding the hit counts. Branch counts here are arrays per branch point, which is why converting to LCOV doubles the branch total if the array is not flattened. Every file in this group describes the same four-file source tree and reports 127/140 lines, 17/24 branch outcomes and 18/20 functions, so a converter can be diffed against a known answer.
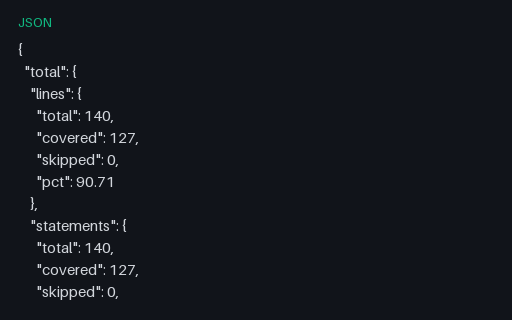
The compact json-summary reporter output: a total block plus one block per file, each with lines, statements, functions and branches as total/covered/skipped/pct. This is what coverage badges and pull-request comments are generated from. Every file in this group describes the same four-file source tree and reports 127/140 lines, 17/24 branch outcomes and 18/20 functions, so a converter can be diffed against a known answer.
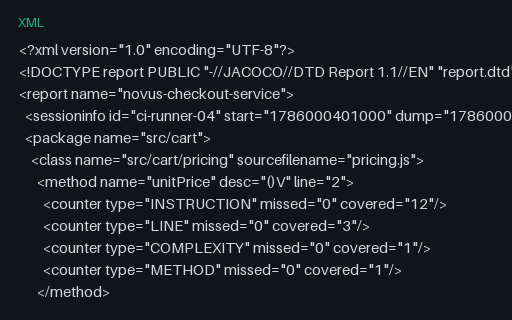
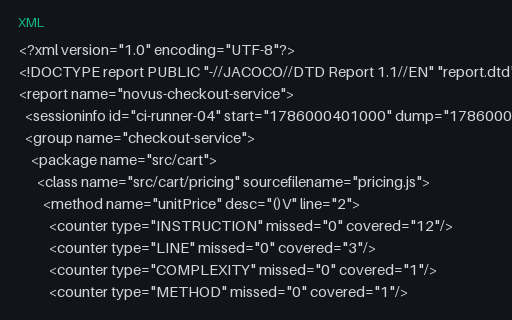
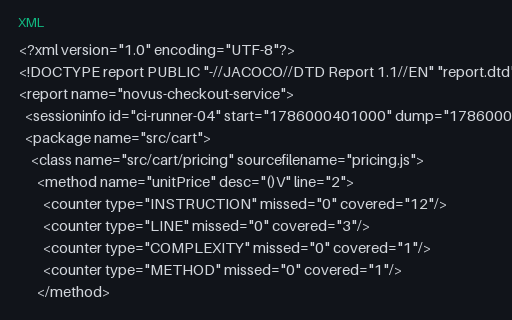
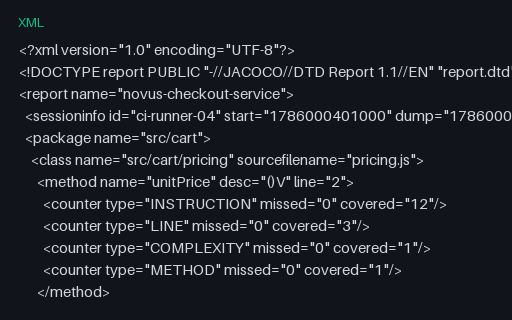
Per-method INSTRUCTION, LINE, COMPLEXITY and METHOD counters for all 20 methods, 2 of which were never entered. This is the detail a "which functions are untested" report needs and the level at which most converters stop.
The aggregate form a multi-module build produces: packages nested inside a <group> rather than directly under <report>. Parsers with a hardcoded report/package path find nothing here and report a module with no coverage at all.
All six JaCoCo counter types present at every level of the document — method, class, sourcefile, package and report. Tools usually read only the report-level LINE counter; this file is for checking that per-method and per-package rollups agree with it.
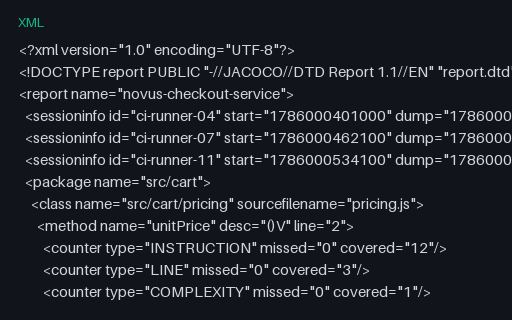
A report merged from three separate JVM sessions, each recorded as its own <sessioninfo> with start and dump timestamps. The counters are already the merged totals, so summing per-session anything from this file is a mistake it exists to catch.
The JaCoCo serialisation, which reports missed/covered pairs rather than found/hit and adds INSTRUCTION and COMPLEXITY counters no other format carries. Converters routinely swap missed for covered here, which inverts the whole report. Every file in this group describes the same four-file source tree and reports 127/140 lines, 17/24 branch outcomes and 18/20 functions, so a converter can be diffed against a known answer.
Every line hit at least once, so LH equals LF exactly. The upper-bound control for a coverage gate, and the case that catches percentage formatting that renders 100% as 100.0% or, worse, rounds 99.95% up to it.
Every instrumented line present with a hit count of zero — the shape of a report from a run in which the tests never loaded the instrumented code. It is not an empty file, and conflating the two hides a broken test harness behind a missing-report warning.
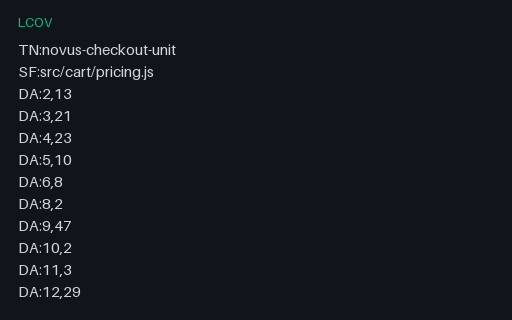
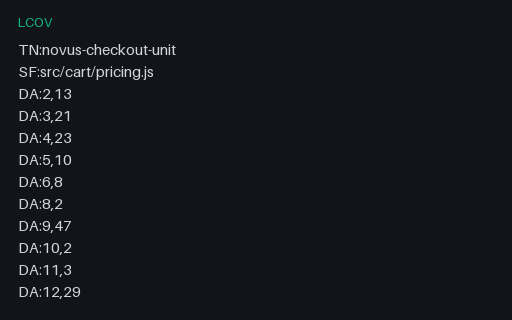
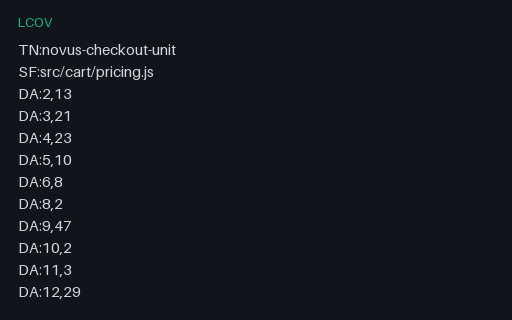
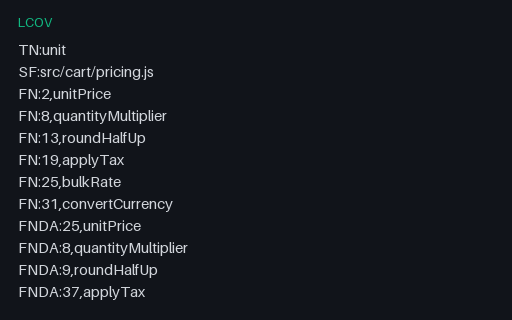
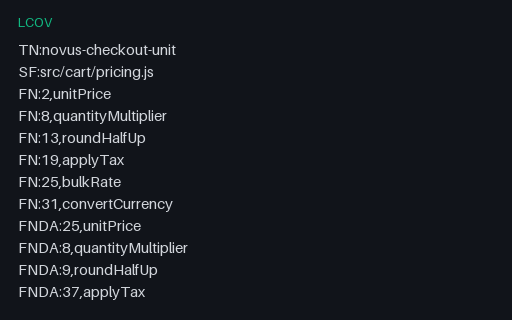
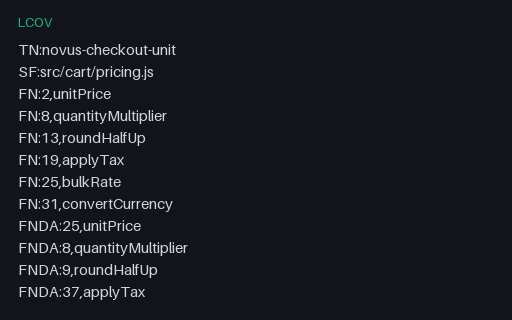
The reference LCOV tracefile: one record per source file with FN/FNDA function records, real BRDA branch records (block, branch and taken count, with '-' for a branch never reached) and DA line hits, closed by the LF/LH, FNF/FNH and BRF/BRH counters. Every file in this group describes the same four-file source tree and reports 127/140 lines, 17/24 branch outcomes and 18/20 functions, so a converter can be diffed against a known answer.
Records containing FN/FNDA/FNF/FNH and nothing else: no DA lines, no LF or LH. Merge tools that assume every record ends with LF/LH either crash here or invent a zero line count for a file that simply was not line-instrumented.
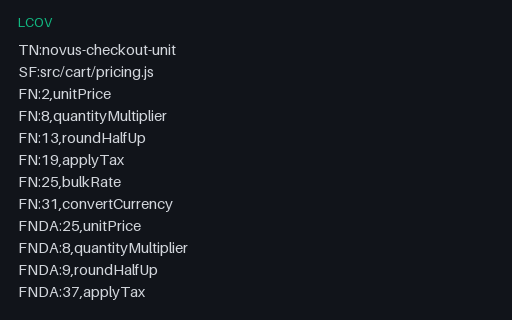
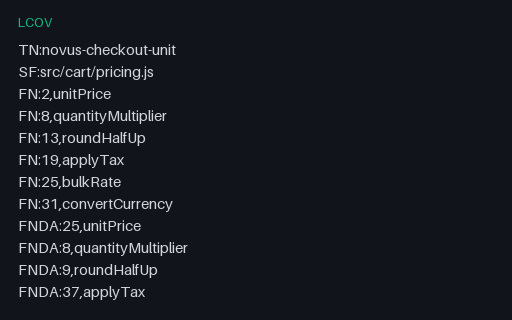
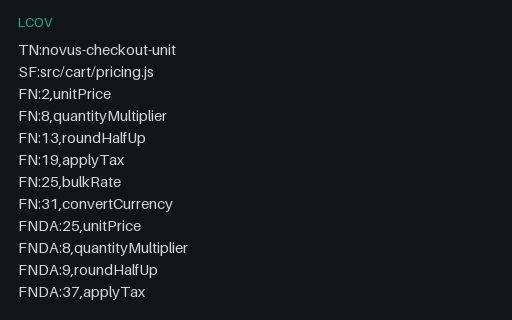
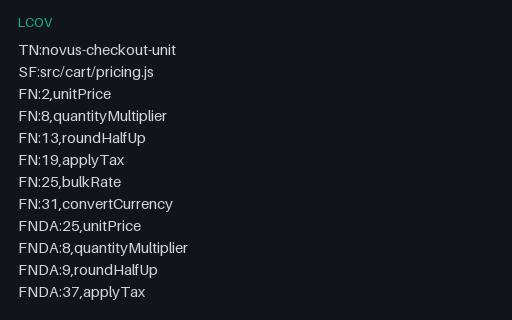
Three named test runs in one tracefile, each covering a different part of the tree, reported via the TN: record most tools quietly discard. Keeping the name is what lets a report answer which suite covered a given line.
Two TN: blocks — a unit run and an integration run — each carrying a full record for the same two source files. A correct merge sums the DA hit counts per line and recomputes LH; a tool that keeps the last record seen throws away the unit run entirely.
The same tracefile with every BRDA, BRF and BRH line removed — what a runner emits when branch instrumentation is off. A gate that reads branch coverage from this file must report it as unavailable, not as 0%, or an unconfigured project looks like a badly tested one.
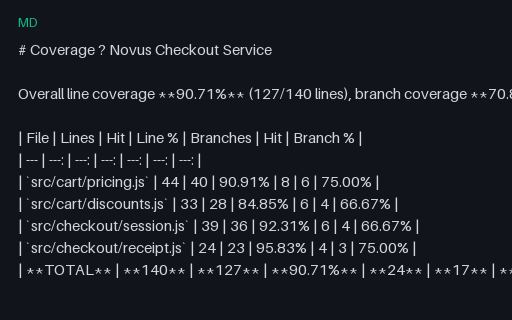
The Markdown comment a coverage bot posts on a pull request: a headline percentage, a per-file table and the uncovered line numbers. Useful for testing Markdown table rendering and for checking that a bot's generated comment matches the machine-readable report it claims to summarise. Every file in this group describes the same four-file source tree and reports 127/140 lines, 17/24 branch outcomes and 18/20 functions, so a converter can be diffed against a known answer.
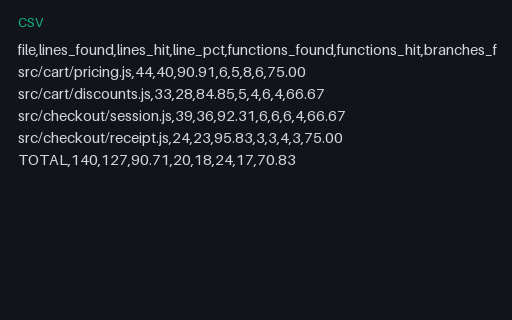
The same coverage as a flat table with a TOTAL row, for spreadsheets, trend charts and diffing two runs without an XML parser. The TOTAL row is the arithmetic sum of the four file rows, so it doubles as a checksum on any tool that regenerates it. Every file in this group describes the same four-file source tree and reports 127/140 lines, 17/24 branch outcomes and 18/20 functions, so a converter can be diffed against a known answer.
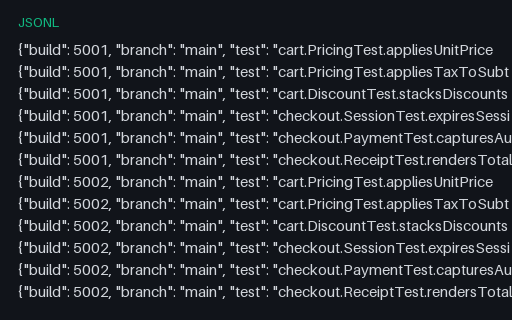
Forty builds of six tests, one JSON object per line, with three tests that fail intermittently and three that never do. This is the input shape a flake detector ingests; the CSV twin in this group holds the aggregate it should produce.
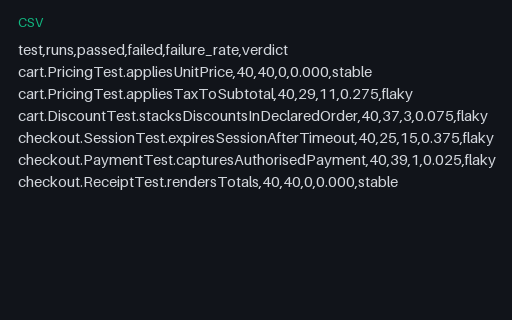
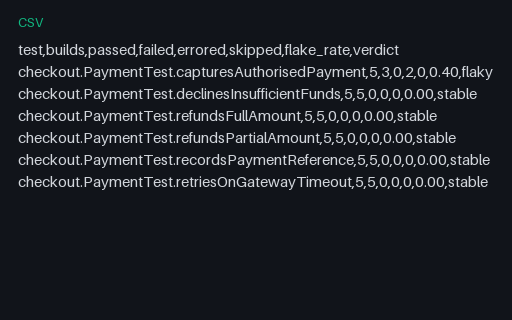
The aggregate answer key for the 40-build history in this group: runs, passes, failures and failure rate per test, with each test labelled stable or flaky. Use it to score a detector rather than eyeballing 240 JSONL records.
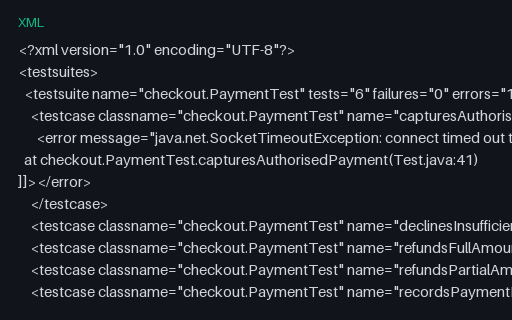
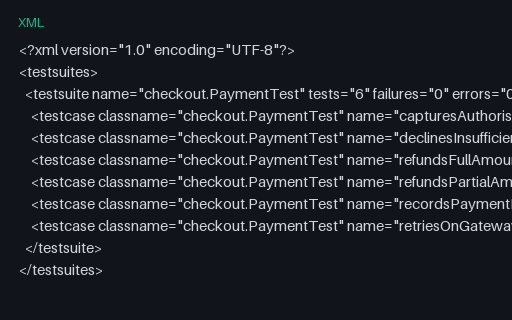
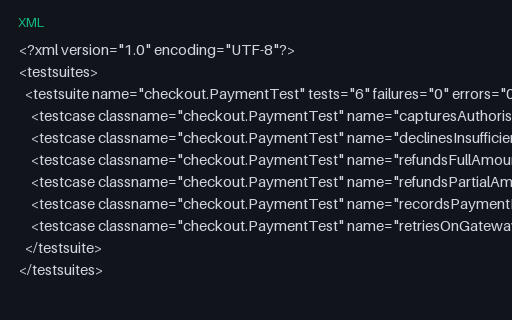
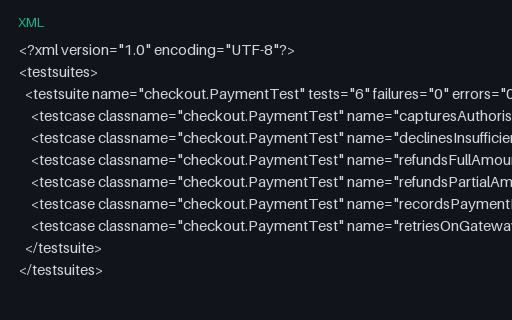
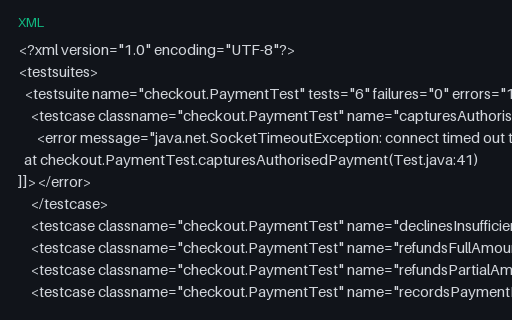
Build #301 of five consecutive runs of checkout.PaymentTest, in which capturesAuthorisedPayment is errored while the other five cases pass every time. The underlying cause is a real call to the fictional payments host instead of the stub. Read the whole family in build order to reproduce what a flake detector sees.
Build #302 of five consecutive runs of checkout.PaymentTest, in which capturesAuthorisedPayment is passing while the other five cases pass every time. The underlying cause is a real call to the fictional payments host instead of the stub. Read the whole family in build order to reproduce what a flake detector sees.
Build #303 of five consecutive runs of checkout.PaymentTest, in which capturesAuthorisedPayment is passing while the other five cases pass every time. The underlying cause is a real call to the fictional payments host instead of the stub. Read the whole family in build order to reproduce what a flake detector sees.
Build #304 of five consecutive runs of checkout.PaymentTest, in which capturesAuthorisedPayment is passing while the other five cases pass every time. The underlying cause is a real call to the fictional payments host instead of the stub. Read the whole family in build order to reproduce what a flake detector sees.
Build #305 of five consecutive runs of checkout.PaymentTest, in which capturesAuthorisedPayment is errored while the other five cases pass every time. The underlying cause is a real call to the fictional payments host instead of the stub. Read the whole family in build order to reproduce what a flake detector sees.
The answer key for the network dependency family: the flake rate a detector should derive from the five build reports next to it. Exactly one of the six tests is unstable, at a rate of 2/5; the other five are stable at 0.00.
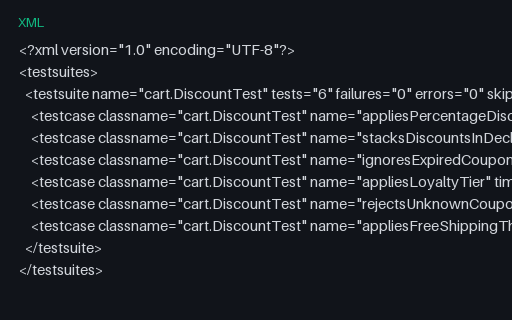
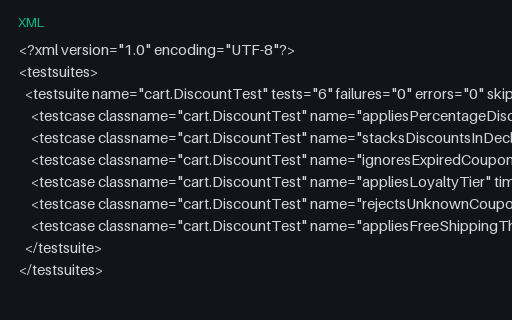
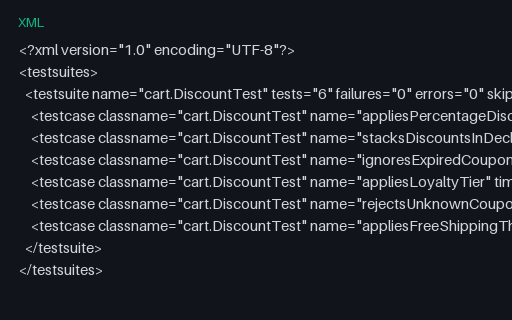
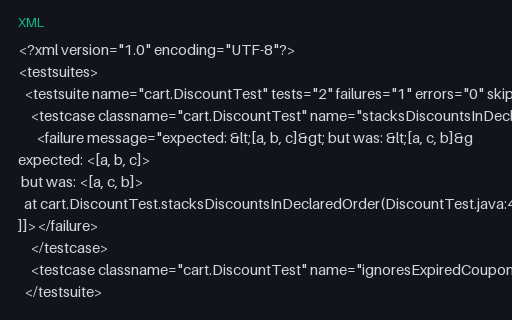
Build #201 of five consecutive runs of cart.DiscountTest, in which stacksDiscountsInDeclaredOrder is passing while the other five cases pass every time. The underlying cause is a shared coupon cache left populated by a sibling test under random ordering. Read the whole family in build order to reproduce what a flake detector sees.
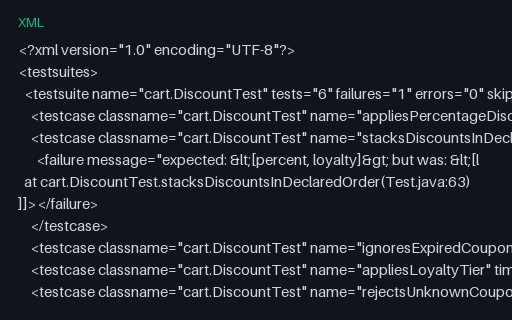
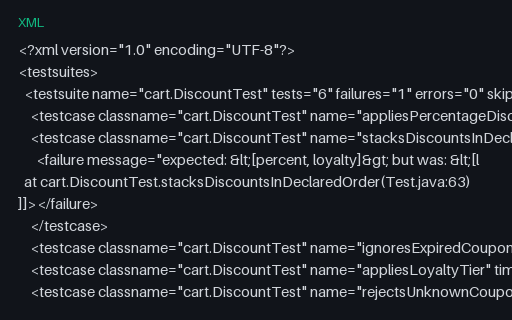
Build #202 of five consecutive runs of cart.DiscountTest, in which stacksDiscountsInDeclaredOrder is failing while the other five cases pass every time. The underlying cause is a shared coupon cache left populated by a sibling test under random ordering. Read the whole family in build order to reproduce what a flake detector sees.
Build #203 of five consecutive runs of cart.DiscountTest, in which stacksDiscountsInDeclaredOrder is failing while the other five cases pass every time. The underlying cause is a shared coupon cache left populated by a sibling test under random ordering. Read the whole family in build order to reproduce what a flake detector sees.
Build #204 of five consecutive runs of cart.DiscountTest, in which stacksDiscountsInDeclaredOrder is passing while the other five cases pass every time. The underlying cause is a shared coupon cache left populated by a sibling test under random ordering. Read the whole family in build order to reproduce what a flake detector sees.
Build #205 of five consecutive runs of cart.DiscountTest, in which stacksDiscountsInDeclaredOrder is passing while the other five cases pass every time. The underlying cause is a shared coupon cache left populated by a sibling test under random ordering. Read the whole family in build order to reproduce what a flake detector sees.
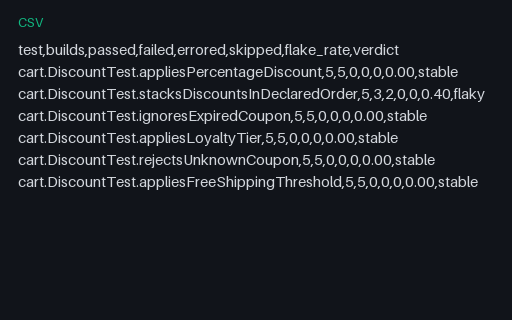
The answer key for the order dependent family: the flake rate a detector should derive from the five build reports next to it. Exactly one of the six tests is unstable, at a rate of 2/5; the other five are stable at 0.00.
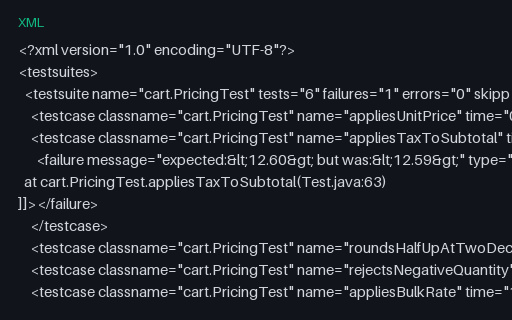
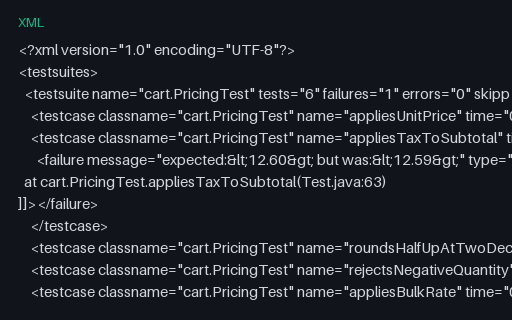
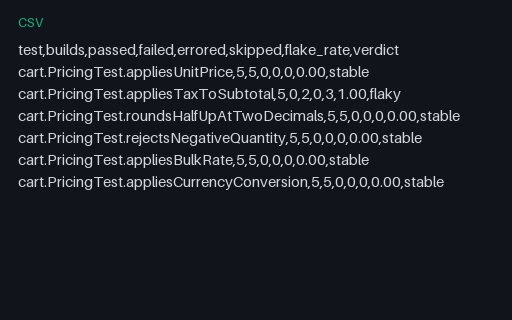
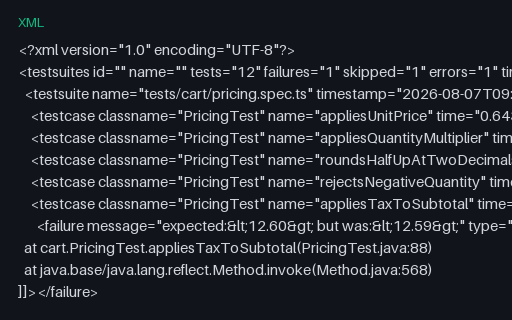
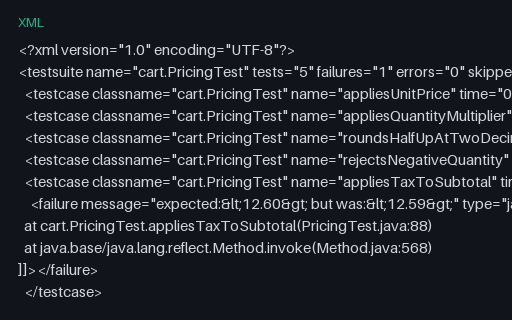
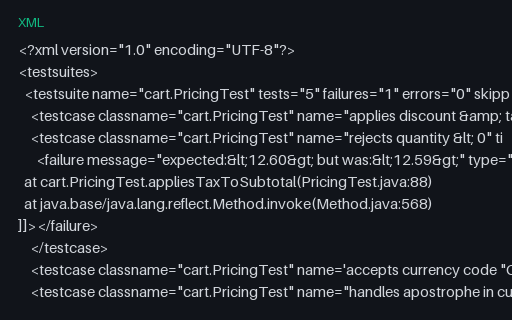
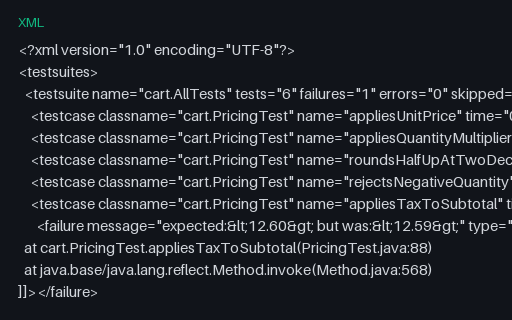
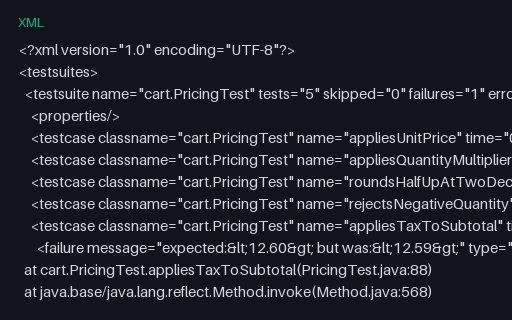
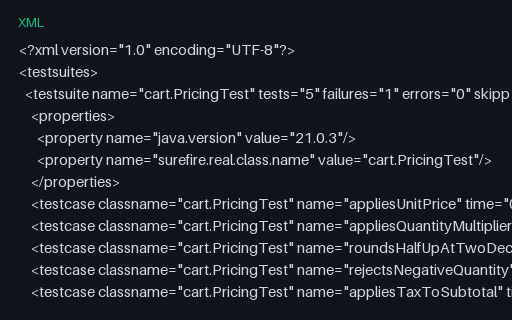
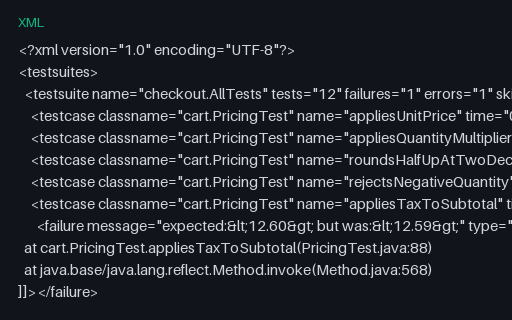
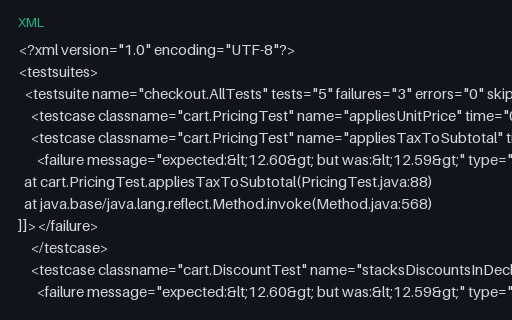
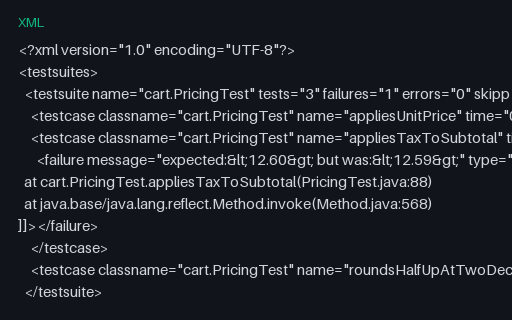
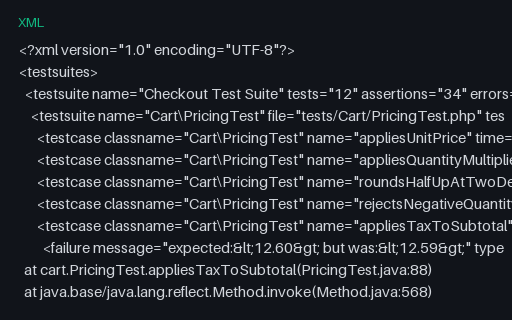
Build #401 of five consecutive runs of cart.PricingTest, in which appliesTaxToSubtotal is failing while the other five cases pass every time. The underlying cause is a rounding boundary that only trips when the tax rate table is reloaded. Read the whole family in build order to reproduce what a flake detector sees.
Build #402 of five consecutive runs of cart.PricingTest, in which appliesTaxToSubtotal is failing while the other five cases pass every time. The underlying cause is a rounding boundary that only trips when the tax rate table is reloaded. Read the whole family in build order to reproduce what a flake detector sees.
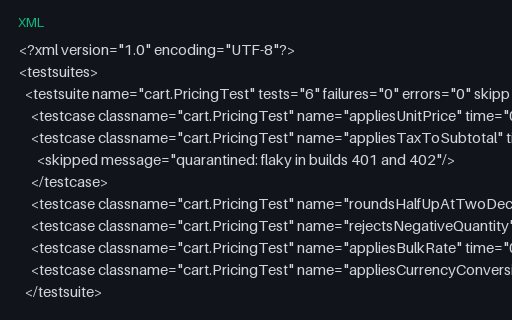
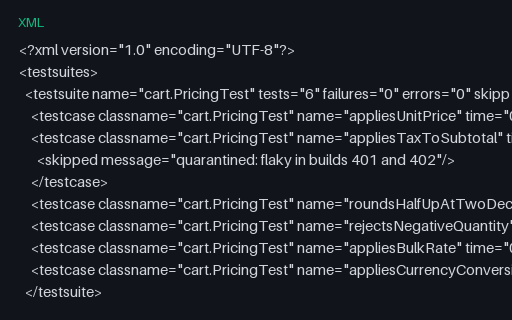
Build #403 of five consecutive runs of cart.PricingTest, in which appliesTaxToSubtotal is quarantined while the other five cases pass every time. The underlying cause is a rounding boundary that only trips when the tax rate table is reloaded. Read the whole family in build order to reproduce what a flake detector sees.
Build #404 of five consecutive runs of cart.PricingTest, in which appliesTaxToSubtotal is quarantined while the other five cases pass every time. The underlying cause is a rounding boundary that only trips when the tax rate table is reloaded. Read the whole family in build order to reproduce what a flake detector sees.
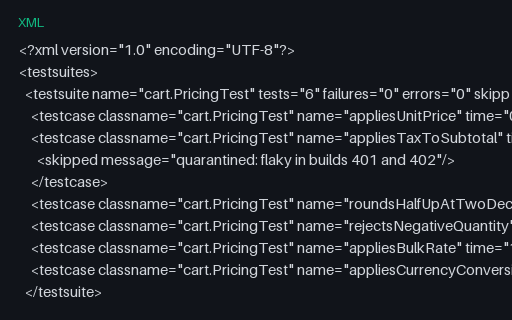
Build #405 of five consecutive runs of cart.PricingTest, in which appliesTaxToSubtotal is quarantined while the other five cases pass every time. The underlying cause is a rounding boundary that only trips when the tax rate table is reloaded. Read the whole family in build order to reproduce what a flake detector sees.
The answer key for the quarantined after two failures family: the flake rate a detector should derive from the five build reports next to it. Exactly one of the six tests is unstable, at a rate of 5/5; the other five are stable at 0.00.
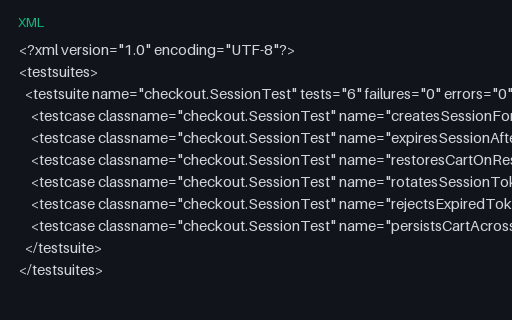
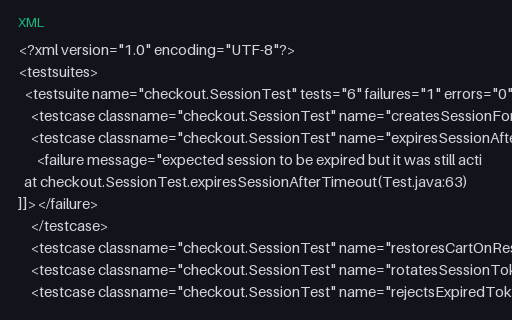
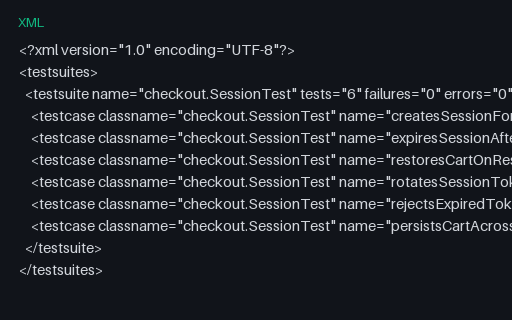
Build #101 of five consecutive runs of checkout.SessionTest, in which expiresSessionAfterTimeout is passing while the other five cases pass every time. The underlying cause is a 250 ms sleep racing the session expiry sweep. Read the whole family in build order to reproduce what a flake detector sees.
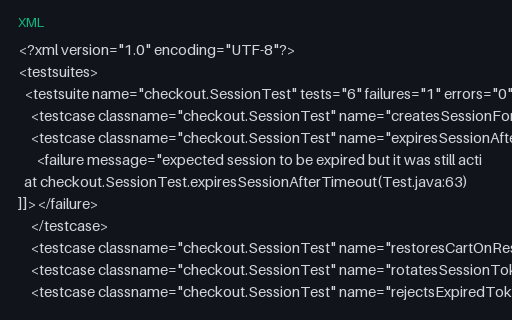
Build #102 of five consecutive runs of checkout.SessionTest, in which expiresSessionAfterTimeout is failing while the other five cases pass every time. The underlying cause is a 250 ms sleep racing the session expiry sweep. Read the whole family in build order to reproduce what a flake detector sees.
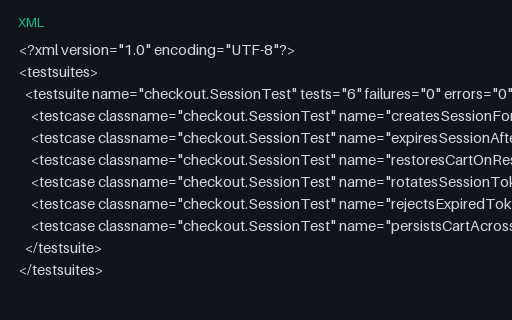
Build #103 of five consecutive runs of checkout.SessionTest, in which expiresSessionAfterTimeout is passing while the other five cases pass every time. The underlying cause is a 250 ms sleep racing the session expiry sweep. Read the whole family in build order to reproduce what a flake detector sees.
Build #104 of five consecutive runs of checkout.SessionTest, in which expiresSessionAfterTimeout is failing while the other five cases pass every time. The underlying cause is a 250 ms sleep racing the session expiry sweep. Read the whole family in build order to reproduce what a flake detector sees.
Build #105 of five consecutive runs of checkout.SessionTest, in which expiresSessionAfterTimeout is passing while the other five cases pass every time. The underlying cause is a 250 ms sleep racing the session expiry sweep. Read the whole family in build order to reproduce what a flake detector sees.
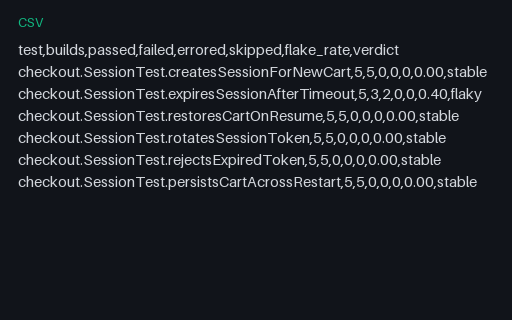
The answer key for the timing race family: the flake rate a detector should derive from the five build reports next to it. Exactly one of the six tests is unstable, at a rate of 2/5; the other five are stable at 0.00.
A PNG response whose body is carried as base64 with content.encoding set accordingly. content.size is the DECODED byte count, not the length of the base64 string, which is the field readers most often get wrong when computing transfer weight.
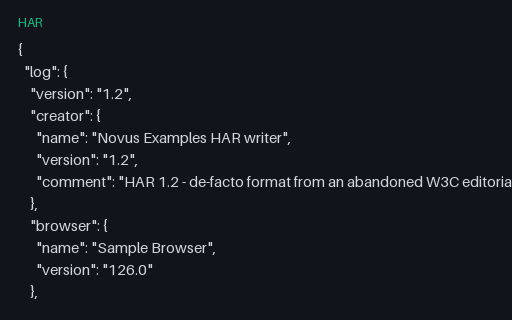
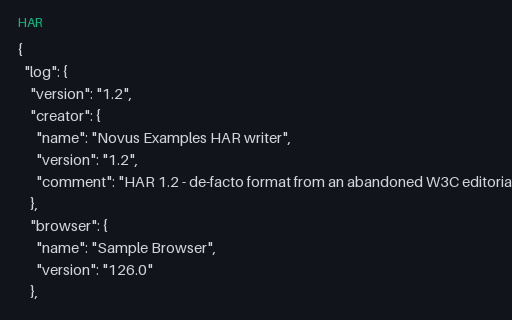
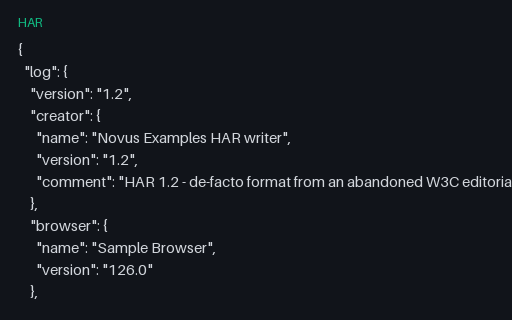
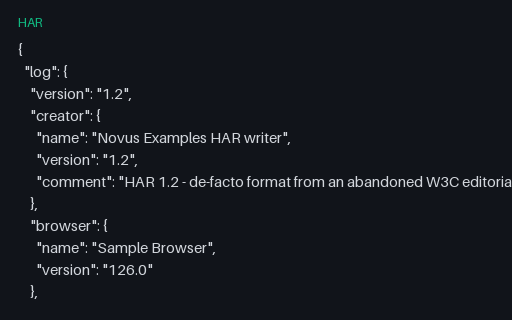
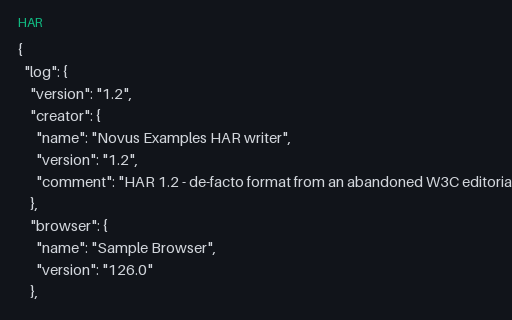
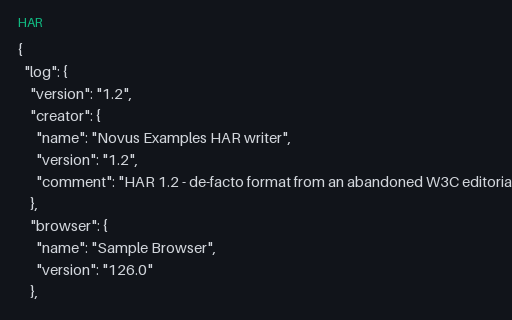
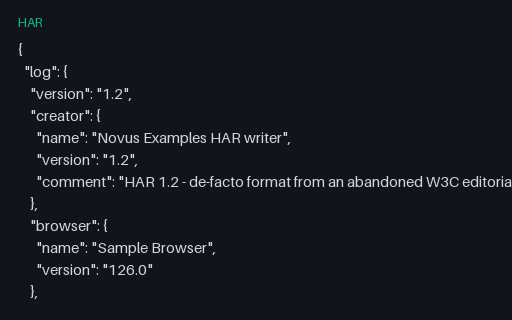
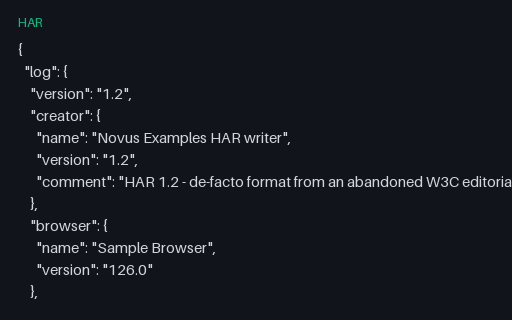
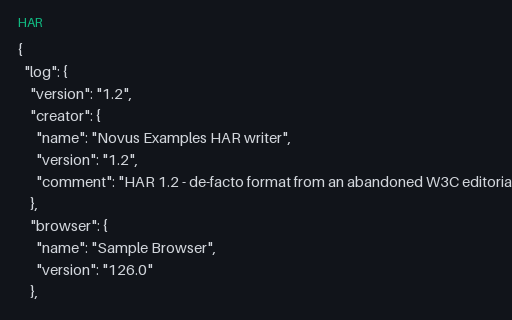
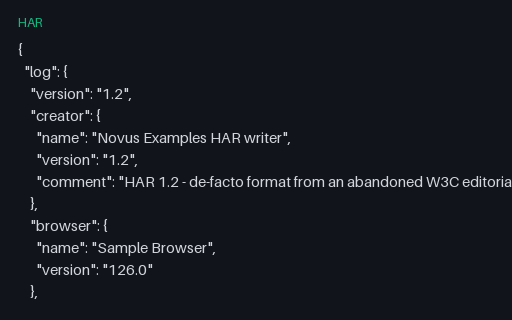
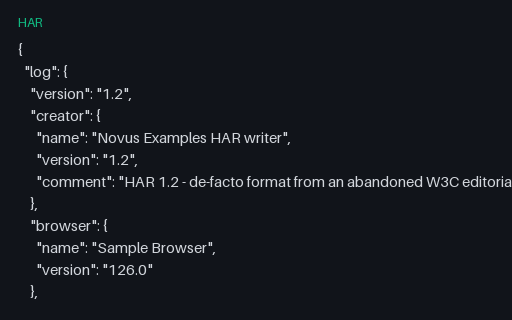
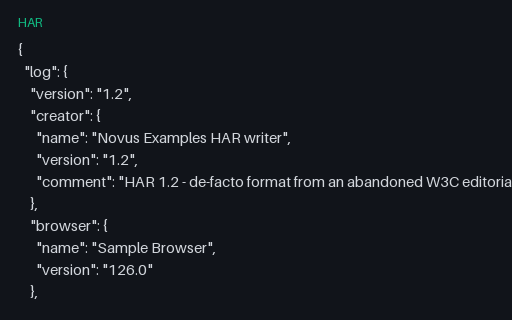
A conditional request answered 304 with full beforeRequest and afterRequest cache state, next to a first-time fetch whose beforeRequest is null. The null is the documented way to say "not in the cache", and readers that treat it as a missing object rather than an explicit absence lose the distinction.
A gzip-compressed JSON response where content.size is the uncompressed length, bodySize is the bytes on the wire, and content.compression is the saving between them. It also carries the non-standard _transferSize field browsers add, which readers must tolerate rather than reject.
A full session-cookie lifecycle: set at login, echoed on the next request, then expired at logout with Max-Age=0. Both the header and the parsed cookies array are present, and every value — including the form password field — is an obvious SAMPLE placeholder rather than a credential.
Five failing requests covering authentication, authorisation, a missing resource, rate limiting with a Retry-After header, and a server error that returns HTML instead of the JSON the client asked for. The last one is the case that breaks clients which parse by status code rather than by content type.
An HTTP/2 entry with lowercase pseudo-headers, an httpVersion of "h2" rather than "HTTP/2.0", an ssl phase inside connect, and three underscore-prefixed custom fields. Version strings are not standardised across writers, so anything matching on "HTTP/1.1" misses this entry entirely.
A four-call REST session against a fictional API host, with JSON request bodies in postData, an Authorization header carrying an obvious SAMPLE placeholder token, and a 204 response that has no body at all. The right shape for testing a HAR-to-mock-server or HAR-to-code converter.
A two-part multipart/form-data upload: a text file part with a fileName and a plain field part. The body uses CRLF between MIME parts because RFC 7578 requires it, even though the surrounding HAR document is LF-terminated — a distinction that matters when a replay tool rewrites the body.
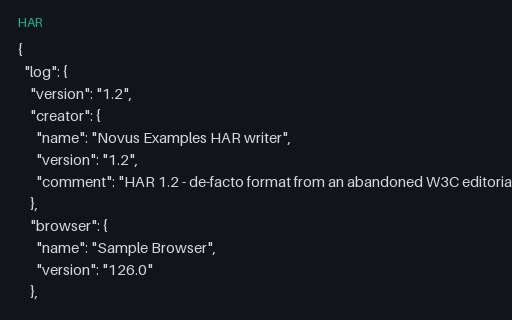
A five-request page load — document, stylesheet, script, image and favicon — across two fictional hosts, with full per-phase timings and an onLoad page timing. Every entry's time equals the sum of its non-negative timing phases, so a waterfall renderer can be checked arithmetically rather than by eye.
One request whose query string encodes a space as %20 in one parameter and as + in another, includes a parameter with an empty value, and carries an Accept-Language header with quality values. The parsed queryString array is the answer key for whatever a URL parser produces from the raw URL.
An http URL that redirects to https and then to a query-carrying cart page, with redirectURL populated on both hops. Tools that count entries as page views report three here when the user saw one page.
Four API calls in which the wait phase — time to first byte — accounts for almost all of the elapsed time, the signature of a server-bound rather than network-bound page. Use it to check that a performance report attributes the cost to the server instead of blaming connection setup.
Two navigations in one capture, with entries bound to their page through pageref. The second page's onLoad is -1, the HAR convention for a timing that never happened, which naive code averages in as zero and reports as an impossibly fast load.
One form submission whose postData carries both the parsed params array and the raw urlencoded text — and the two must agree. The notes field contains a comma and an ampersand, so a decoder that splits before unescaping produces seven fields instead of five.
The same 12-case Novus Checkout run written the way @playwright/test 1.47 junit reporter writes it. Playwright puts the run totals on the <testsuites> root, names each suite after its spec file, and uses the bare describe title as classname. All eight dialect files in this group report 12 tests, 1 failure, 1 error and 1 skip, so a JUnit parser can be held to identical totals across every producer.
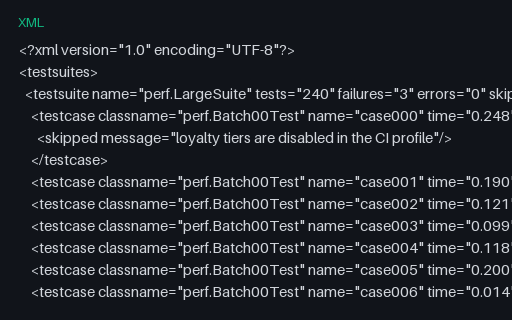
240 cases across six classes, three of them failing. Big enough to time a parser and to check that a report UI paginates or virtualises rather than rendering every row, but still small enough to read.
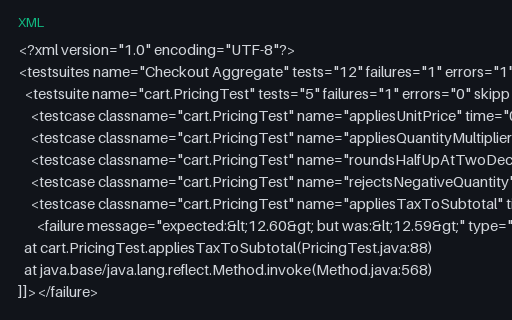
Three suites under a <testsuites> root whose own attributes already hold the aggregate totals. A parser that sums the children and also trusts the root double-counts every case, which is the classic cause of a dashboard reporting 24 tests for a 12-test run.
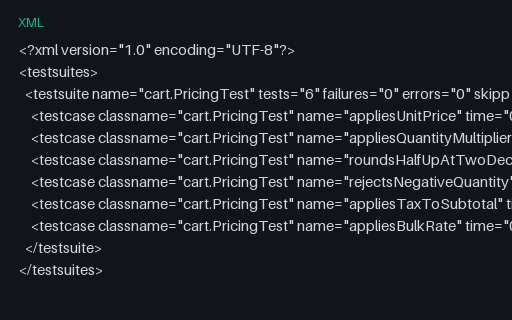
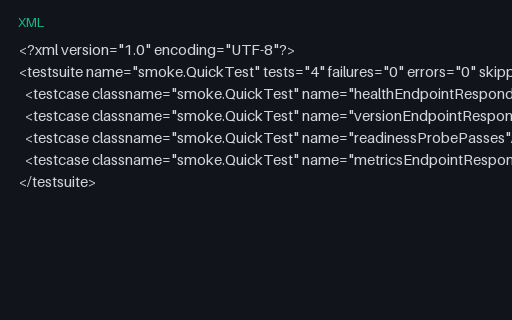
A clean green run: six passing cases, zero failures, errors and skips. The baseline a CI gate should treat as success, and the control case for any dashboard that colours a build from the failure count.
The single-suite form Gradle and Ant write: the root element is <testsuite> with no <testsuites> wrapper at all. Parsers hardcoded to descend from <testsuites> read this file as empty rather than failing, so it silently reports a run of zero tests.
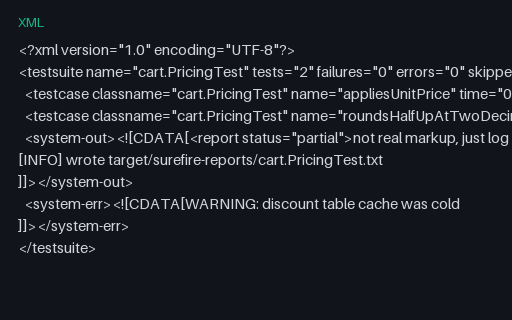
Captured stdout and stderr wrapped in CDATA, where the stdout text itself looks like XML markup. A parser must treat the CDATA content as opaque characters; one that re-parses it finds a <report> element that does not exist.
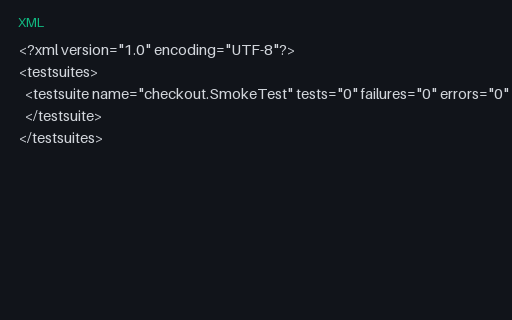
A structurally valid report containing a suite with no <testcase> children at all — what a runner writes when a filter matched nothing. Aggregators that divide by the test count to compute a pass rate hit a zero denominator here.
One <failure> (an assertion that did not hold) and one <error> (an exception the test never expected), side by side. Parsers that collapse the two lose the distinction between a broken assertion and a broken environment.
Test names containing &, <, >, quotes and an apostrophe, escaped as XML requires. Round-tripping this report through a converter is the fastest way to find double-escaping bugs that turn & into &amp; one hop at a time.
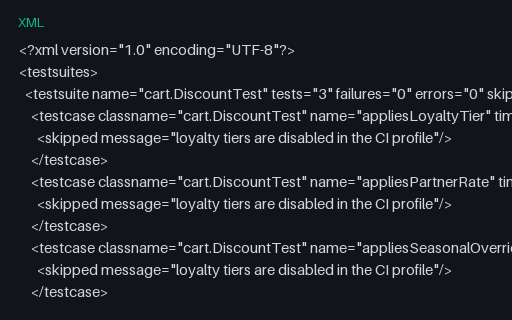
A suite in which every case was skipped, so tests equals skipped and nothing actually ran. A gate that reads only the failure count calls this green; one that checks executed>0 catches it.
Cases annotated with the source file and line they were declared on, as pytest and several JS runners emit. This is what a code-review annotation bot needs to place a failure comment on the right line of the right file.
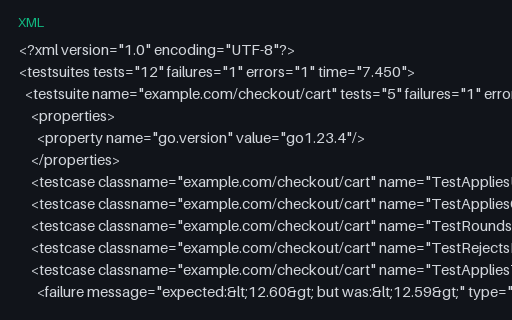
The same 12-case Novus Checkout run written the way go-junit-report 2.1 writes it. go-junit-report names each suite after a Go package and carries the toolchain version in a go.version property. All eight dialect files in this group report 12 tests, 1 failure, 1 error and 1 skip, so a JUnit parser can be held to identical totals across every producer.
The same 12-case Novus Checkout run written the way Gradle 8.9 Test task writes it. Gradle writes hostname and timestamp on every suite and an empty self-closing <properties/> element that some parsers mishandle. All eight dialect files in this group report 12 tests, 1 failure, 1 error and 1 skip, so a JUnit parser can be held to identical totals across every producer.
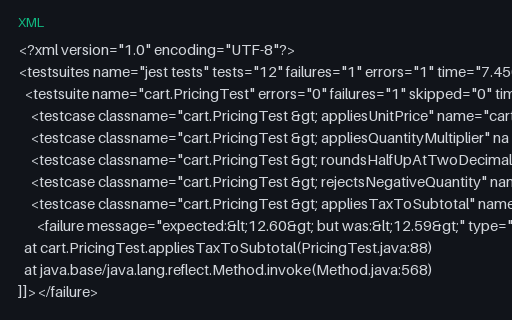
The same 12-case Novus Checkout run written the way jest-junit 16 writes it. jest-junit repeats the whole "describe > it" title in both classname and name, which breaks dashboards that assume classname is a package. All eight dialect files in this group report 12 tests, 1 failure, 1 error and 1 skip, so a JUnit parser can be held to identical totals across every producer.
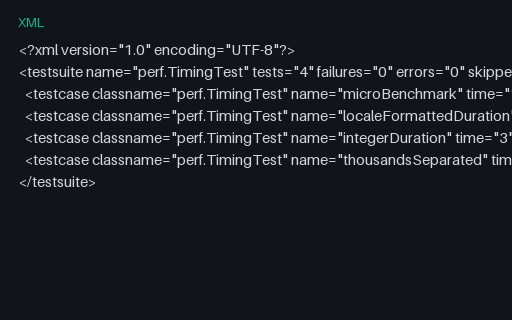
Durations written four different ways in one file: scientific notation, a comma decimal separator from a German-locale JVM, a bare integer, and a comma that could be either a decimal point or a thousands separator. A parser using a locale-sensitive number reader gets a different answer depending on where it runs.
The same 12-case Novus Checkout run written the way maven-surefire 3.2 writes it. Maven Surefire merges its per-class files under a <testsuites> root and adds a <properties> block plus system-out/system-err on every suite. All eight dialect files in this group report 12 tests, 1 failure, 1 error and 1 skip, so a JUnit parser can be held to identical totals across every producer.
The full canonical run flattened into a single suite: nine passes, one failure, one error and one skip. This is the same twelve cases the eight dialect files carry, so totals can be compared straight across.
A failure whose message contains an expected/actual diff with angle brackets and newlines, the shape assertion libraries actually produce. Good for checking that a dashboard escapes the message for HTML and keeps its line breaks.
Three failures spread across three different classes in one suite. Use it to check that a reporter lists every failure rather than stopping at the first, and that it groups them by classname rather than by suite.
A report from a runner that never records durations: neither the suite nor any case carries a time attribute. Dashboards that parse time unconditionally throw here, and ones that default it to zero quietly report a suite that took no time at all.
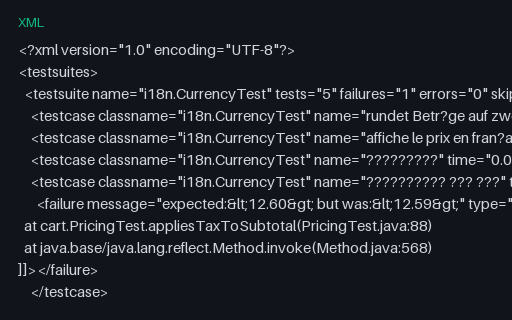
Test names in German, French, Japanese, Greek and Russian, stored as UTF-8 with no BOM and an explicit encoding declaration. A reporter that assumes the platform default encoding produces mojibake here rather than an error.
Three cases, one of them failing with an assertion message and a CDATA stack trace. The smallest report that must turn a build red, and the one to test a failure-summary renderer against.
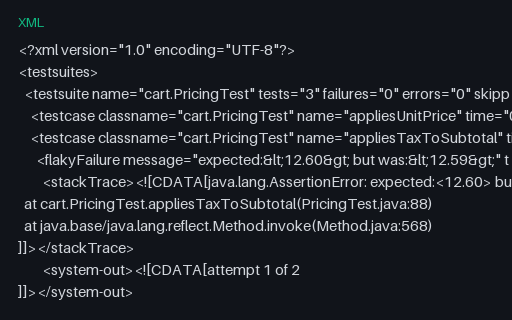
A case that failed on its first attempt and passed on the retry, recorded with Surefire's <flakyFailure> child. The suite counters say zero failures, so a parser that ignores the extension element reports a clean run and loses the flake entirely.
The same 12-case Novus Checkout run written the way PHPUnit 11.2 --log-junit writes it. PHPUnit nests per-class suites inside a named parent suite and adds an assertions count that no other dialect reports. All eight dialect files in this group report 12 tests, 1 failure, 1 error and 1 skip, so a JUnit parser can be held to identical totals across every producer.
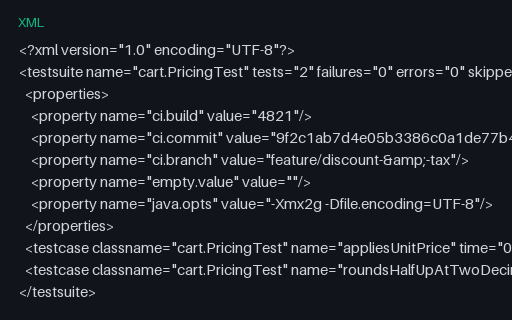
A <properties> block holding an empty value, an escaped ampersand in a branch name and a JVM options string with spaces. Use it to check that build metadata survives extraction with its entities unescaped exactly once.
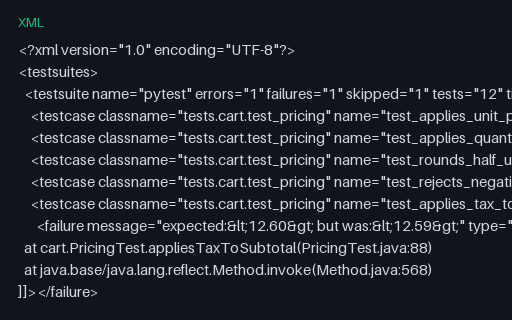
The same 12-case Novus Checkout run written the way pytest 8.2 --junitxml writes it. pytest emits a single <testsuite name="pytest"> whose classname is the dotted module path, and decorates each case with file and line attributes. All eight dialect files in this group report 12 tests, 1 failure, 1 error and 1 skip, so a JUnit parser can be held to identical totals across every producer.
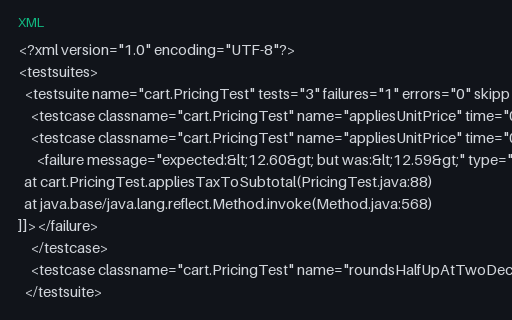
The same classname and name appear twice with different outcomes — what a parameterised runner or a merged report can produce. Any store keyed on classname+name overwrites the first result and reports the suite as green or red depending purely on document order.
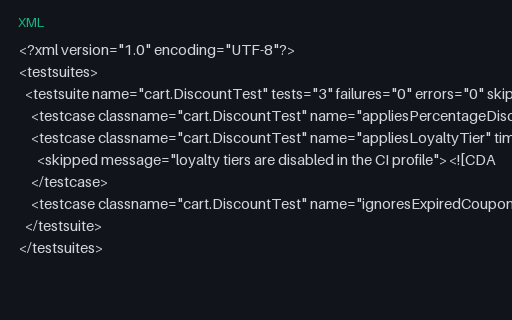
A skipped case whose reason appears twice — in the message attribute and again as CDATA text inside the <skipped> element. Reporters that read only the attribute silently drop the longer explanation.
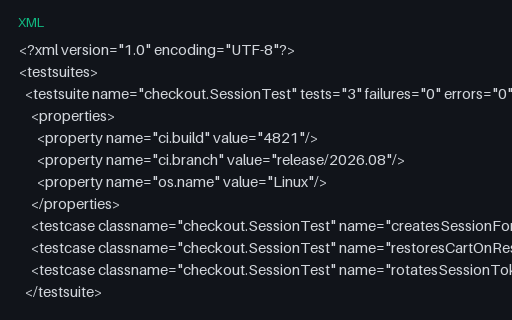
Every optional run-metadata attribute a JUnit suite may carry — timestamp, hostname, package, id — plus a properties block holding build and branch identifiers. Use it to test that a dashboard reads build context from the report instead of from its own environment.
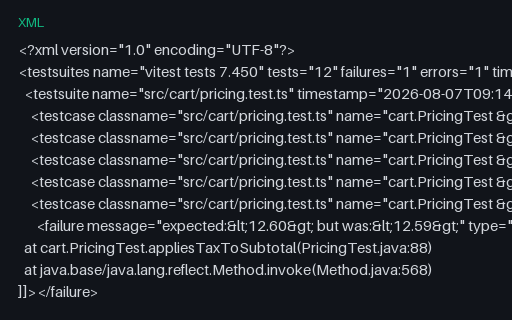
The same 12-case Novus Checkout run written the way vitest 2.0 junit reporter writes it. Vitest names the root suite after the elapsed time and uses the spec file path as classname for every case. All eight dialect files in this group report 12 tests, 1 failure, 1 error and 1 skip, so a JUnit parser can be held to identical totals across every producer.
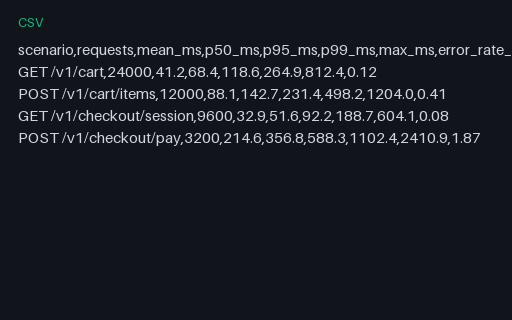
The percentile table a performance report renders as a chart, with mean, p50, p95, p99 and max for each of the four scenarios. The same numbers appear inside the JSON summary in this group, so a chart built from either source can be diffed against the other.
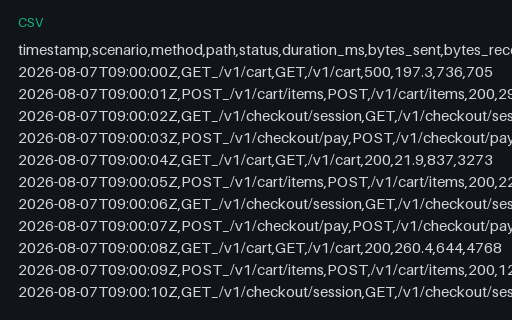
Three hundred individual request records with timestamp, scenario, status and duration — the raw log a percentile calculation has to be computed from rather than read off. A handful of 4xx and 5xx responses are mixed in so an error-rate calculation has something to find.
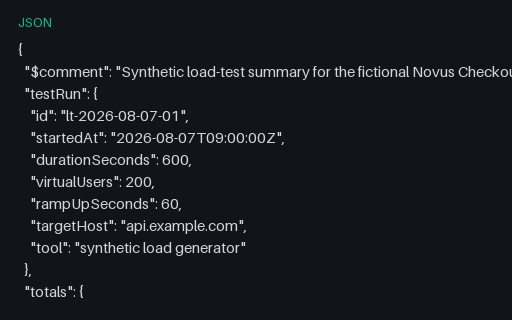
A load-test run summary in the shape a threshold-checking CI step consumes: totals, per-scenario percentiles, and three named thresholds each carrying its limit, the observed value and a pass flag. Publishing the limit next to the observation is what lets a gate be re-evaluated without rerunning the test.
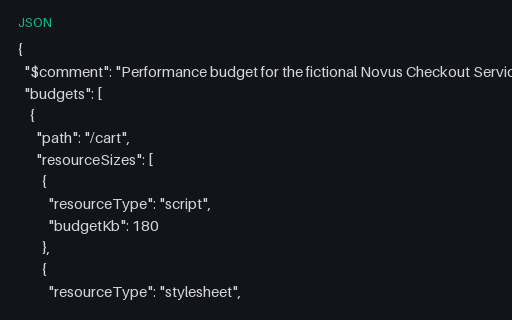
A budget file pairing per-path resource-size and timing limits with API latency budgets, including a glob path that must be matched rather than compared for equality. It is the configuration side of the load-test results in this group: the limits a run is judged against.
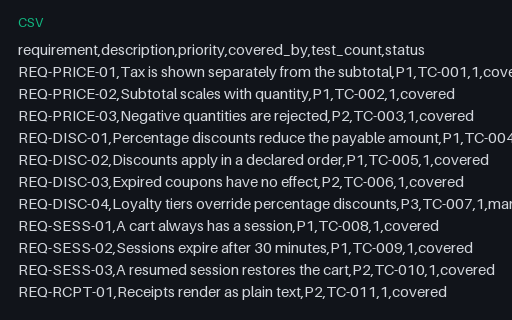
Thirteen requirements mapped to the test cases that cover them — and one, REQ-PAY-02, deliberately covered by nothing. A coverage-gap report that does not surface that row is not working, which makes this the answer key for exactly that check.
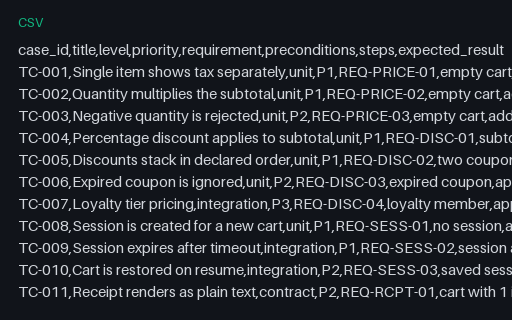
Twelve test cases with level, priority, the requirement each covers, preconditions, steps and expected result — the table a test-management import expects. Eleven of the twelve are automated, and the requirement column joins this file to the traceability matrix next to it.
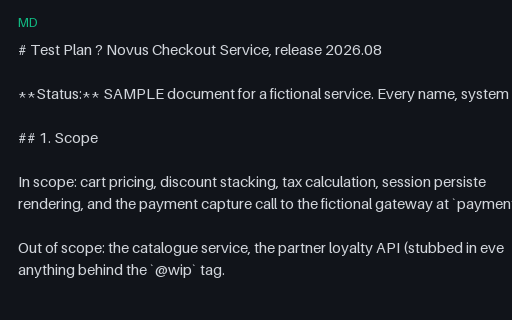
A complete release test plan for the fictional Novus Checkout Service — scope, test levels, entry and exit criteria, a risk table and deliverables. Useful as a Markdown-rendering fixture with three tables and nested lists, and as a realistic input for documentation tooling that has to extract structure from prose.
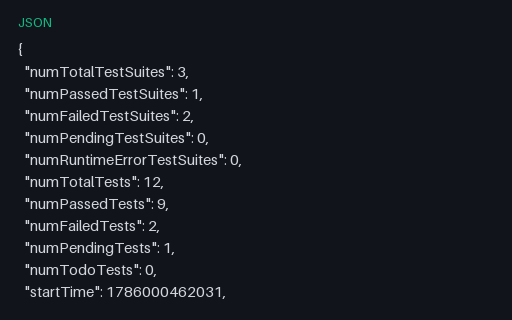
Jest's --json output, where skipped tests are called pending and the totals appear as flat numTotal/numPassed/numFailed fields alongside per-file assertionResults. Timestamps are epoch milliseconds rather than ISO strings, which is the field most converters mis-handle. Reports the same canonical run as the JUnit dialect files: 12 tests, 9 passed, 1 assertion failure, 1 error and 1 skip.
Mocha's JSON reporter, which lists every test in a tests array and then repeats each one in passes, failures or pending. Summing all four arrays counts the run twice — this file exists so that bug shows up on a 12-test suite instead of in production. Reports the same canonical run as the JUnit dialect files: 12 tests, 9 passed, 1 assertion failure, 1 error and 1 skip.
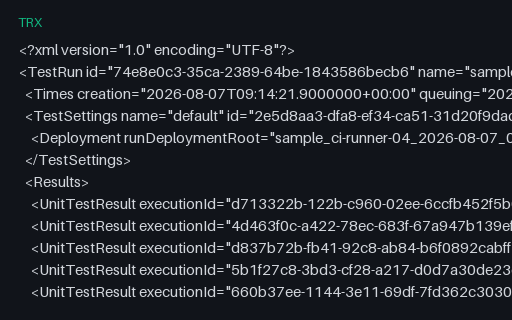
The `dotnet test` TRX document in full: Times, TestSettings, Results, TestDefinitions, TestEntries, TestLists and a ResultSummary with sixteen counters. Results and definitions are joined on GUIDs, so a converter that reads only <Results> loses every class name. Reports the same canonical run as the JUnit dialect files: 12 tests, 9 passed, 1 assertion failure, 1 error and 1 skip.
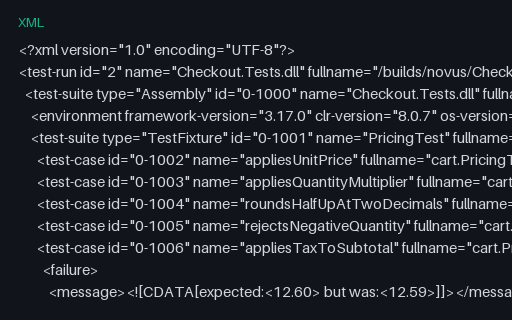
The NUnit 3 test-run document, with a nested Assembly/TestFixture suite tree, an environment element and per-case seeds. NUnit has no separate error outcome, so the errored case appears as Failed with label="Error" and the report reads failed=2. Reports the same canonical run as the JUnit dialect files: 12 tests, 9 passed, 1 assertion failure, 1 error and 1 skip.
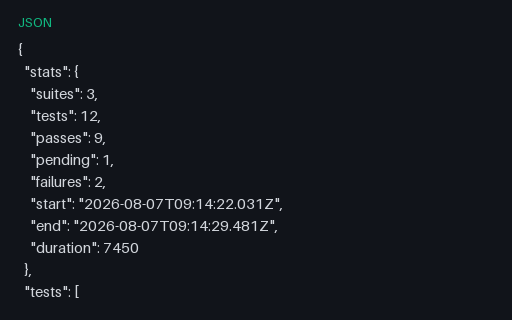
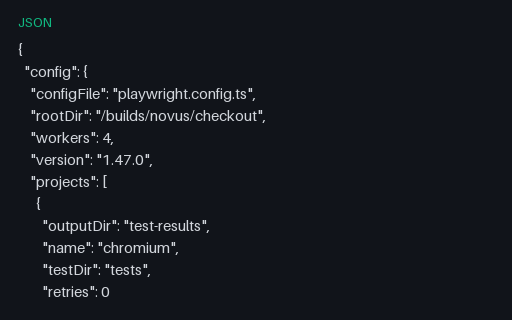
Playwright's native JSON report, four levels deep: suites contain specs, specs contain tests (one per project) and tests contain results (one per attempt). Its stats use expected/unexpected rather than passed/failed, because a test annotated as expected-to-fail counts as expected when it fails. Reports the same canonical run as the JUnit dialect files: 12 tests, 9 passed, 1 assertion failure, 1 error and 1 skip.
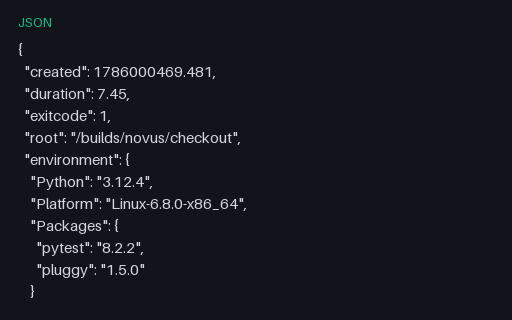
The pytest-json-report document, which records setup, call and teardown as three separate phases per test and keeps error distinct from failed in its summary. A test can pass its call phase and still error in teardown, which is why summing outcomes without reading the phases gives the wrong total. Reports the same canonical run as the JUnit dialect files: 12 tests, 9 passed, 1 assertion failure, 1 error and 1 skip.
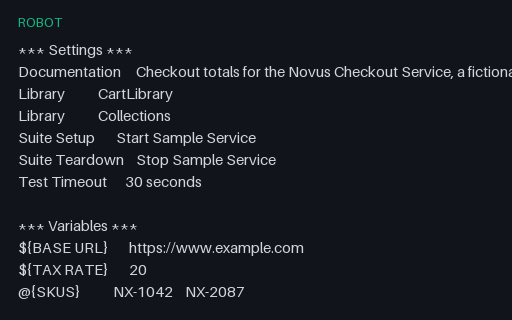
A complete Robot Framework suite with all four common sections, scalar, list and dictionary variables, a continued line using ..., and user keywords with arguments. Robot separates arguments on two or more spaces, so a parser splitting on a single space merges every keyword call into one token.
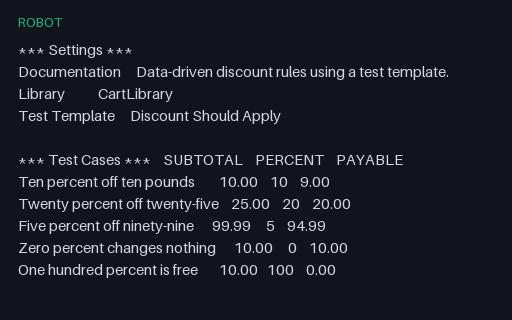
The template form, in which the *** Test Cases *** header itself names the argument columns and each row becomes one test. Five tests share a single keyword body, and a parser that reads the header row as a test name reports six.
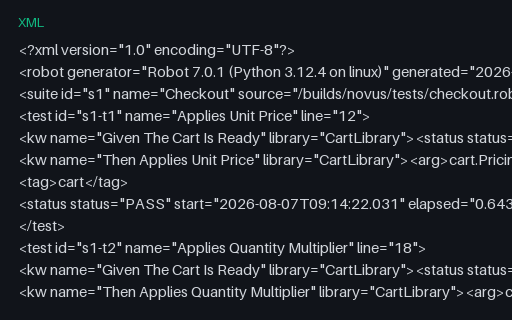
Robot Framework's output.xml, in which every keyword call carries its own status element and a trailing statistics section restates the totals by tag and by suite. Robot 7 reports elapsed seconds rather than the endtime attribute older versions used, so schemaversion is what a reader must branch on. Reports the same canonical run as the JUnit dialect files: 12 tests, 9 passed, 1 assertion failure, 1 error and 1 skip.
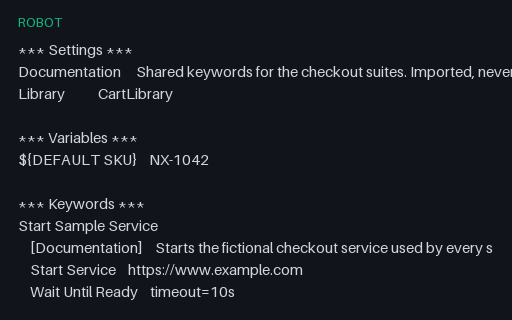
A resource file: keywords, variables and imports with no *** Test Cases *** section at all, meant to be imported by the suites next to it. Tooling that requires at least one test case rejects a perfectly ordinary resource, and keyword defaults such as ${qty}=1 are where argument parsers usually stop.
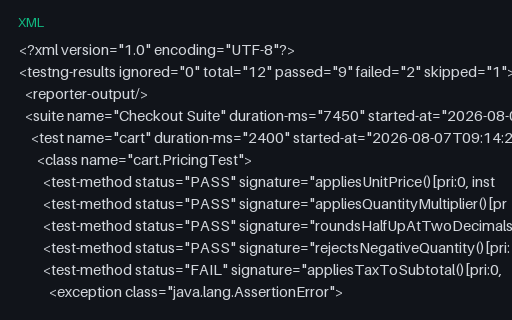
TestNG's own result document, with suite/test/class/test-method nesting, signature attributes and full stack traces in CDATA. TestNG has no error status, so the errored case is reported as FAIL and the header attributes read failed=2. Reports the same canonical run as the JUnit dialect files: 12 tests, 9 passed, 1 assertion failure, 1 error and 1 skip.
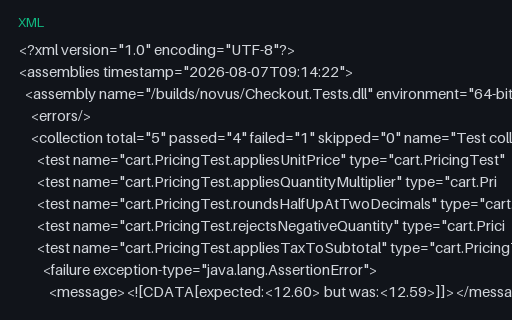
The xUnit.net v2 shape: an <assemblies> root holding one assembly, whose tests are grouped into collections rather than classes. Result values are Pass, Fail and Skip with capital initials, which trips converters doing a case-sensitive comparison against the lowercase values every other format uses. Reports the same canonical run as the JUnit dialect files: 12 tests, 9 passed, 1 assertion failure, 1 error and 1 skip.
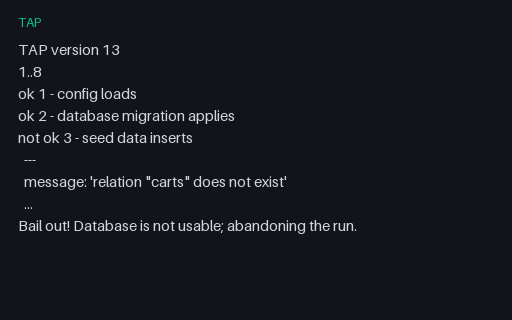
A run abandoned after the third assertion with a Bail out! line, leaving five of the planned eight assertions unreported. The run is a failure even though only one assertion said not ok, and a consumer must not report 2/3 passing as a 67% pass rate.
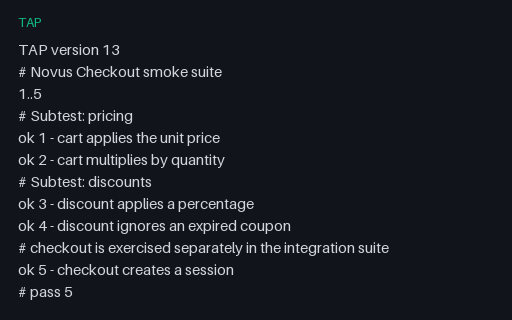
Free-form # comment lines interleaved with assertions, including a trailing summary block. Comments carry no result and must never shift assertion numbering, which is exactly what a parser counting lines instead of ok/not ok tokens gets wrong.
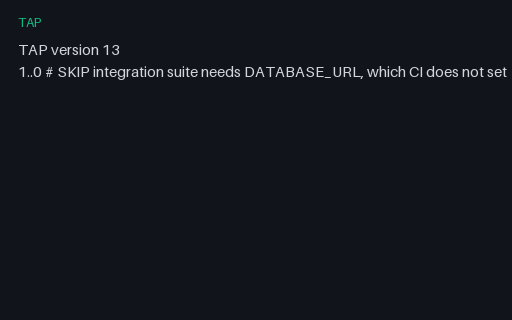
A whole suite declined in a single line: a zero-length plan with a SKIP directive and a reason. It is a valid, complete TAP stream containing no assertions, and a consumer must report it as skipped rather than as an empty pass or a parse error.
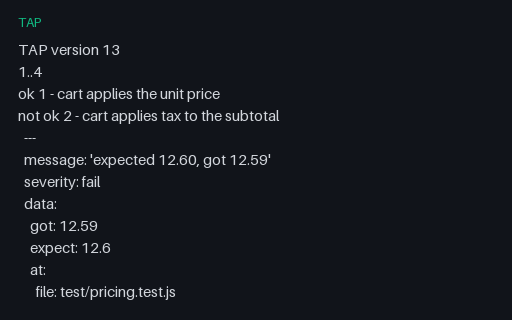
Two failing assertions, each followed by an indented YAML diagnostic block carrying the expected and actual values and a file/line location. The block is where every useful failure message in TAP lives, and it is the part naive line-based parsers throw away.
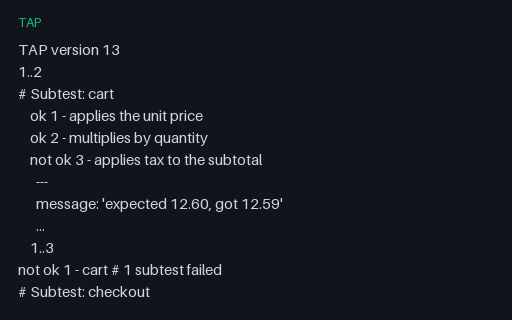
Two subtests, each an indented TAP stream with its own plan, rolled up into two top-level assertions. Flatten it and you count seven assertions instead of two; ignore the indentation and the nested failure is counted twice.
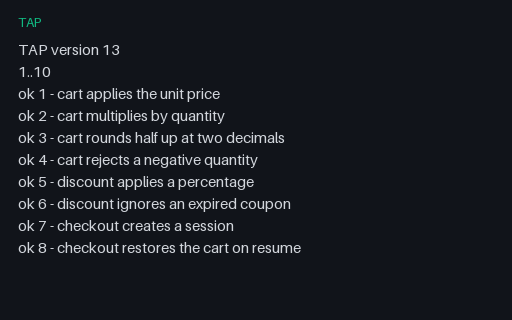
Every assertion in this stream says ok, but the plan promised ten and only eight arrived — the signature of a runner that crashed after its last reported assertion. A consumer that only counts not ok lines calls this a clean pass.
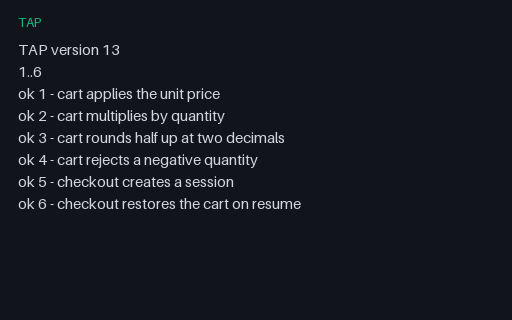
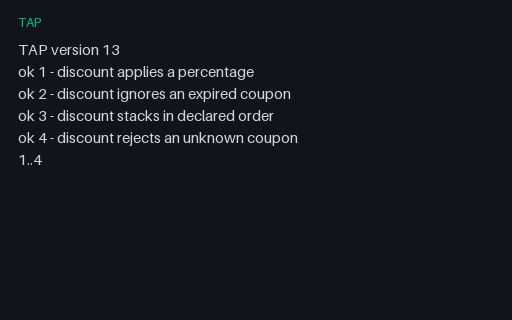
The canonical TAP shape: a version line, a leading plan, then six passing assertions in order. Anything a TAP consumer does with a real stream it must do with this one first.
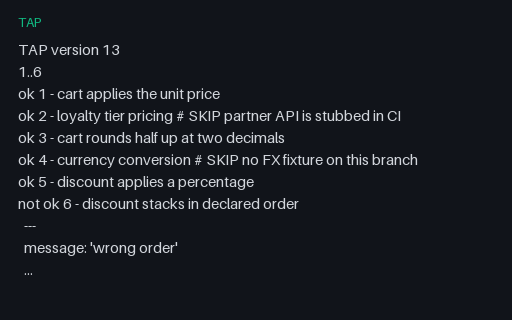
Two assertions marked # SKIP with a reason, alongside a genuine failure. Skipped assertions are written as ok, so counting ok lines reports 5 passes when only 3 tests actually ran.
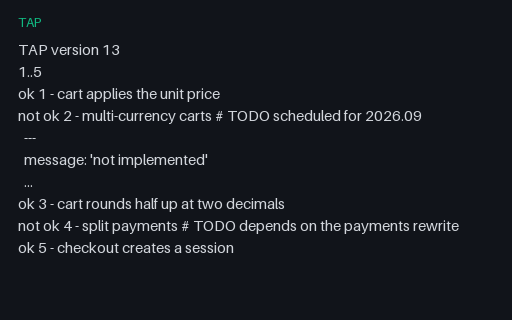
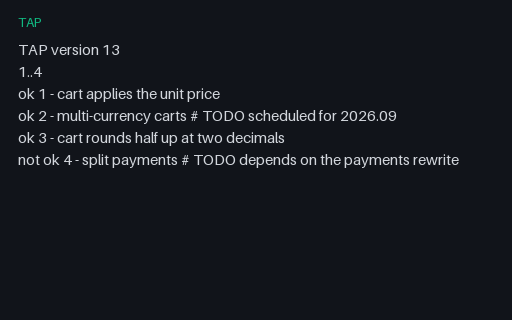
Two failing assertions marked # TODO, meaning they are known-unfinished work rather than regressions. A TODO failure must not fail the run, so a consumer that treats every not ok as a build breaker turns this green run red.
Assertion 2 is marked TODO but reports ok — an unexpected success, which means the feature landed and the marker is now stale. Harnesses such as prove report this as a bonus rather than a pass, and dropping the distinction lets stale TODOs accumulate forever.
The same stream with the plan at the end, which is what a harness emits when it does not know the test count up front. A consumer that requires a leading plan rejects a perfectly valid stream.
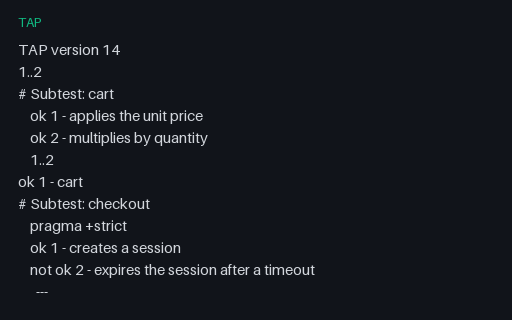
TAP 14 with an explicit version line and a pragma inside a subtest. Consumers pinned to version 13 either reject the stream outright or ignore the pragma, so this file separates the two behaviours.
JUnit and NUnit XML, MSTest TRX, TAP, Cucumber and Playwright JSON, Gherkin .feature files, and Robot Framework suites — plus Cobertura, JaCoCo, Clover, LCOV, and Istanbul JSON for coverage.
Do the coverage reports agree with each other?+
Yes. Coverage fixtures in different formats describe the same fictional source tree with the same totals, so you can run a converter and assert the numbers survive the round trip.
Are there failing and malformed reports too?+
Yes — passing, failing, skipped, and flaky runs, plus intentionally malformed reports labelled as such in title and description so a parser can be tested for failing loudly.
We use Google Analytics and show ads via Adsterra. Non-essential cookies and ad scripts run only after you allow the matching categories. See our cookie policy.