
Flaky Detection — Per-Test Failure-Rate Summary (CSV)
The aggregate answer key for the 40-build history in this group: runs, passes, failures and failure rate per test, with each test labelled stable or flaky. Use it to score a detector rather than eyeballing 240 JSONL records.
test,runs,passed,failed,failure_rate,verdict
cart.PricingTest.appliesUnitPrice,40,40,0,0.000,stable
cart.PricingTest.appliesTaxToSubtotal,40,29,11,0.275,flaky
cart.DiscountTest.stacksDiscountsInDeclaredOrder,40,37,3,0.075,flaky
checkout.SessionTest.expiresSessionAfterTimeout,40,25,15,0.375,flaky
checkout.PaymentTest.capturesAuthorisedPayment,40,39,1,0.025,flaky
checkout.ReceiptTest.rendersTotals,40,40,0,0.000,stable
Specifications
- Seed
- 61200
- Rows
- 6
- Columns
- 6
- Delimiter
- ,
- Header
- true
- Derived From
- test-run-history.jsonl
- Builds
- 40
- Line Endings
- LF
Testing contract
Reference control- Scenario
- Verify a flake detector's aggregate output against a known answer.
- Expected result
- Every row matches the counts derivable from test-run-history.jsonl, and exactly the tests labelled flaky here have a failure rate strictly between 0 and 1.
What is a .csv file?
CSV (Comma-Separated Values) is a plain-text tabular format where rows are lines and fields are separated by commas, with quoting rules for values that contain delimiters, quotes, or newlines. It has no formal type system and depends on encoding and dialect conventions. It is the most portable format for tabular data exchange.
How to use this file
Use an example CSV to test parsers against quoting and embedded-delimiter edge cases, header handling, encoding detection, and import pipelines into databases or spreadsheets.
How to use this file for testing
“Flaky Detection — Per-Test Failure-Rate Summary (CSV)” is a deterministic Novus Examples fixture for CSV parsing, Conversion testing, Time-series data. Clean and deliberately messy CSVs — quoted commas, embedded newlines, ragged rows, odd delimiters, and encodings.
Documented properties for this file: seed 61200 · 6 rows · 6 columns · LF. Compare results against paired or grouped companions on this page when present (clean↔damaged, searchable↔scanned, or format twins) so scores stay reproducible across runs.
Download the file once, keep the path stable in CI or local scripts, and treat the spec table as the contract: dimensions, seeds, field lists, and roles are intentional. Corrupt or invalid samples are labelled as such — expect parsers to fail loudly rather than silently accept them.
Test and coverage reports document their totals (suites, cases, passes, failures, skips, covered lines) in the spec table. Point your CI dashboard, coverage gate, or report converter at the file and assert those counts survive; format twins carry identical numbers so a conversion can be scored exactly.
Feed the file to your parser and assert it handles the documented quirks — quoted delimiters, embedded newlines, ragged rows, or invalid syntax; the valid↔invalid distinction is labelled in the title.
Code examples
import pandas as pd

df = pd.read_csv("test-run-history-summary.csv")
print(df.head())
print(df.dtypes)
Related files
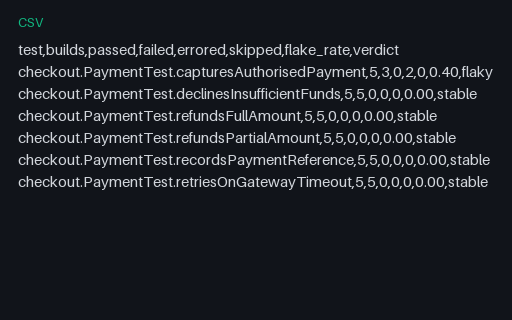
- csvFlaky Run — Network Dependency, Flake-Rate Table (CSV)The answer key for the network dependency family: the flake rate a detector should derive from the five build reports next to it. Exactly one of the six tests is unstable, at a rate of 2/5; the other five are stable at 0.00.
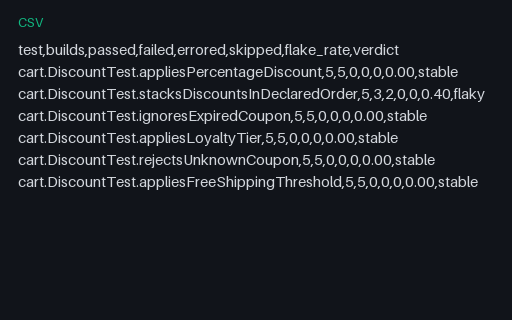
- csvFlaky Run — Order Dependent, Flake-Rate Table (CSV)The answer key for the order dependent family: the flake rate a detector should derive from the five build reports next to it. Exactly one of the six tests is unstable, at a rate of 2/5; the other five are stable at 0.00.
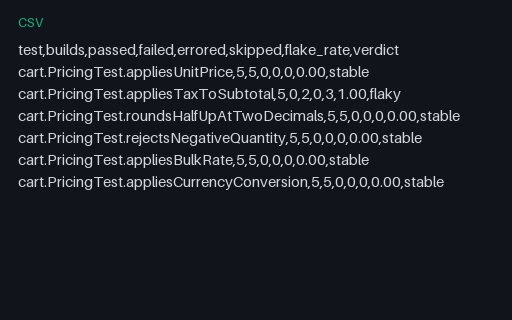
- csvFlaky Run — Quarantined After Two Failures, Flake-Rate Table (CSV)The answer key for the quarantined after two failures family: the flake rate a detector should derive from the five build reports next to it. Exactly one of the six tests is unstable, at a rate of 5/5; the other five are stable at 0.00.
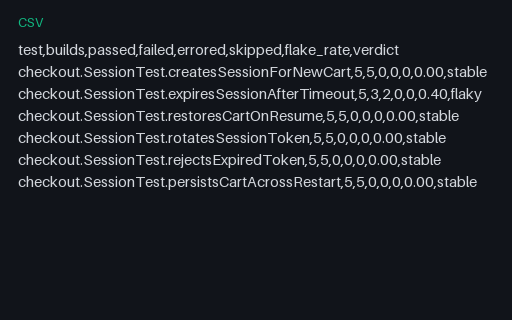
- csvFlaky Run — Timing Race, Flake-Rate Table (CSV)The answer key for the timing race family: the flake rate a detector should derive from the five build reports next to it. Exactly one of the six tests is unstable, at a rate of 2/5; the other five are stable at 0.00.
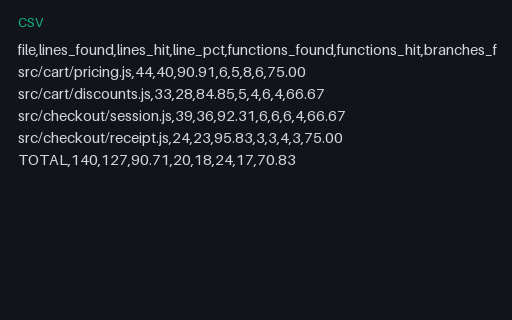
- csvCoverage — Per-File Table (CSV)The same coverage as a flat table with a TOTAL row, for spreadsheets, trend charts and diffing two runs without an XML parser. The TOTAL row is the arithmetic sum of the four file rows, so it doubles as a checksum on any tool that regenerates it. Every file in this group describes the same four-file source tree and reports 127/140 lines, 17/24 branch outcomes and 18/20 functions, so a converter can be diffed against a known answer.
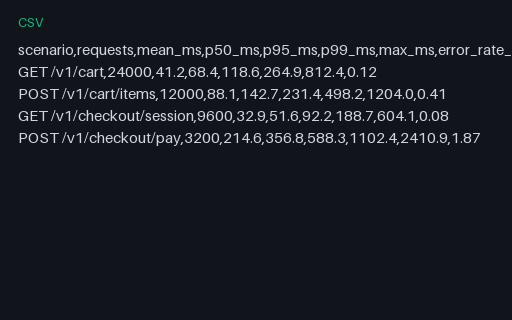
- csvLoad Test — Latency Percentiles by Scenario (CSV)The percentile table a performance report renders as a chart, with mean, p50, p95, p99 and max for each of the four scenarios. The same numbers appear inside the JSON summary in this group, so a chart built from either source can be diffed against the other.
Generated by generation/testing.py. Free for any use, no attribution required — license.