
log
398 BNginx Access Log
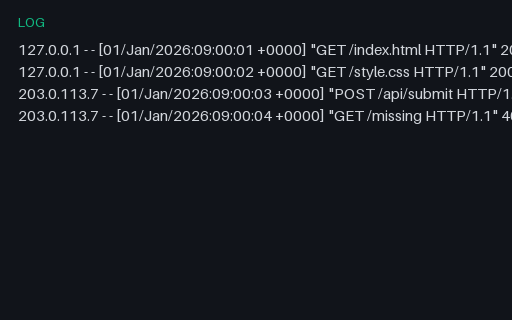
An nginx combined-format access log with several requests, including a 403 and a 404 — for testing log parsers.
- File
- LOG · Logs · 4 records
- Use case
- Log parsing
Access logs and JSON-lines application logs — for testing log parsers, tailers, and ingestion pipelines.
An nginx combined-format access log with several requests, including a 403 and a 404 — for testing log parsers.
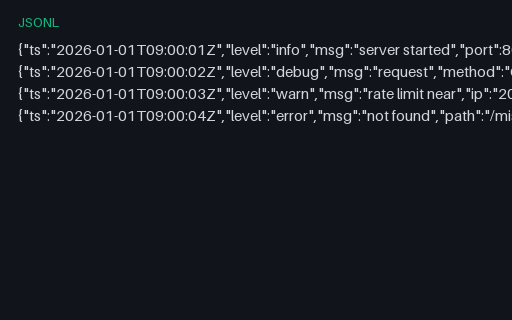
A structured application log with one JSON object per line at info/debug/warn/error levels — for testing log ingestion.
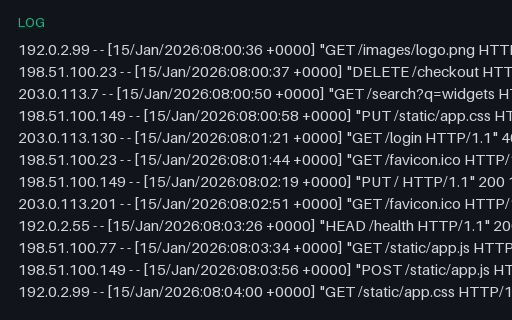
An Apache access log in the Common Log Format (CLF) — client, timestamp, request line, status, and byte count. Deterministic, with reserved documentation IPs. Paired with a Combined-format twin for testing log parsers.
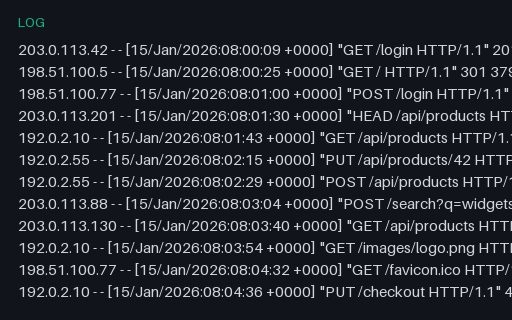
An Apache access log in the Combined Log Format — the Common fields plus referer and user-agent. A realistic web-server log for testing access-log parsers, analytics, and grok patterns.
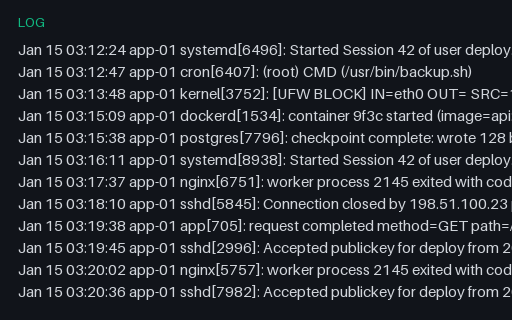
A BSD-style syslog (RFC 3164) sample — timestamp, host, process and PID, then the message, across sshd, cron, kernel, nginx, and application entries. A fixture for testing syslog parsers and forwarders.
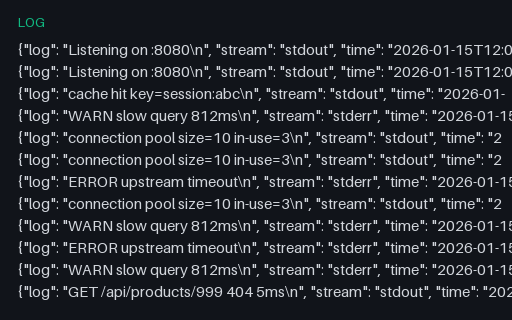
A Docker json-file container log — one JSON object per line with the log text, stream (stdout/stderr), and an RFC 3339 timestamp, exactly as Docker's default logging driver writes it. A fixture for container-log shippers and parsers.
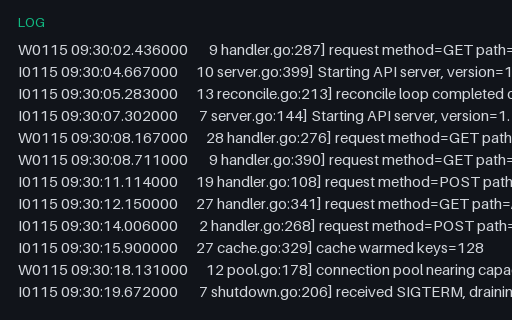
A Kubernetes-component log in the klog/glog format — a severity letter, timestamp, thread id, and source location prefix followed by the message. A fixture for testing klog parsers and severity extraction.
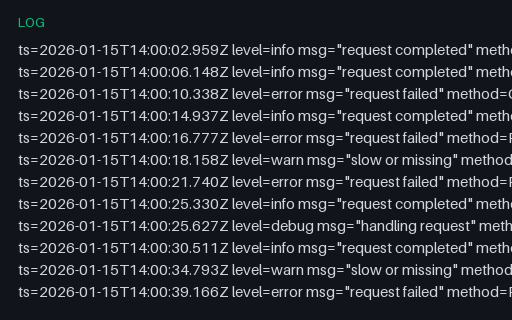
A structured application log in logfmt — space-separated key=value pairs (ts, level, msg, method, path, status, duration, request_id) as used by many Go and Heroku-style services. A fixture for testing logfmt parsers.
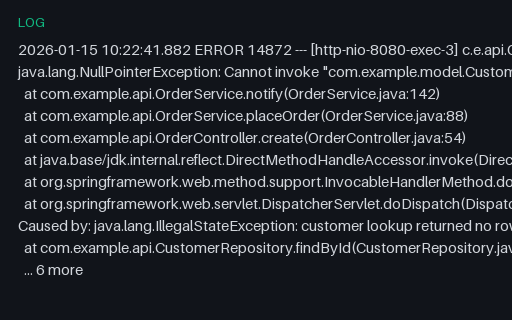
A realistic Java stack trace — a Spring-style NullPointerException with a nested 'Caused by' chain and '... N more' elision. A fixture for testing stack-trace parsers, error groupers, and log viewers.
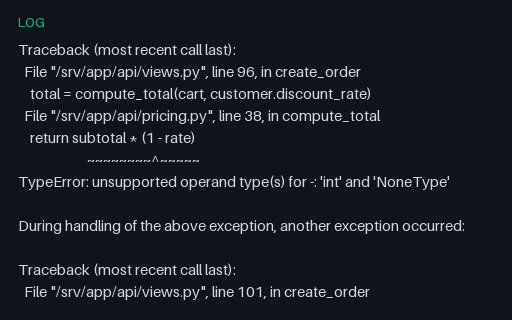
A realistic Python traceback with a chained exception ('During handling of the above exception...') and a caret error indicator. A fixture for testing traceback parsers and error-reporting tools.
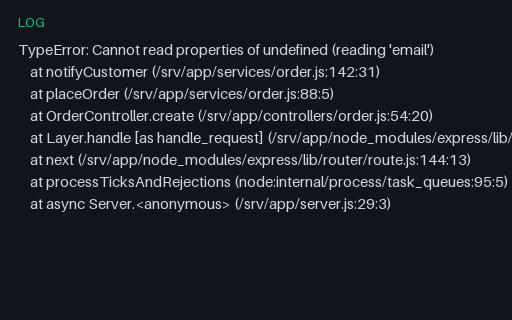
A realistic Node.js/Express stack trace — a TypeError with V8-style 'at function (file:line:col)' frames including an async frame and internal node: frames. A fixture for testing JS stack-trace parsers.
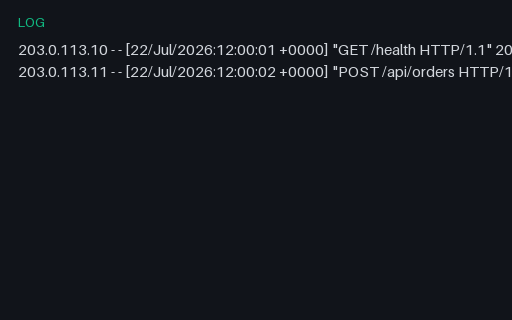
Tiny SAMPLE log excerpt (nginx-access-sample) for parser and alert-rule tests.
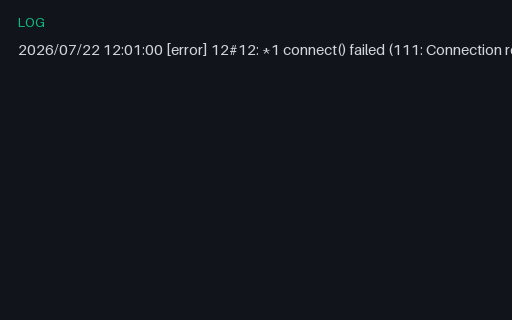
Tiny SAMPLE log excerpt (nginx-error-sample) for parser and alert-rule tests.
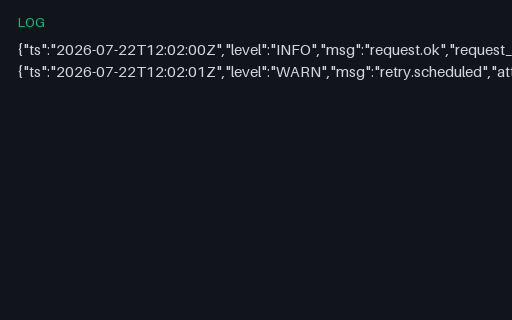
Tiny SAMPLE log excerpt (app-json-structured) for parser and alert-rule tests.
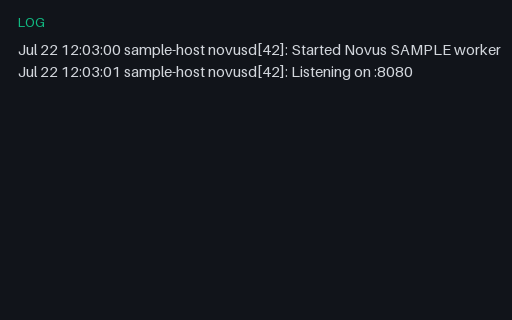
Tiny SAMPLE log excerpt (systemd-journal-excerpt) for parser and alert-rule tests.
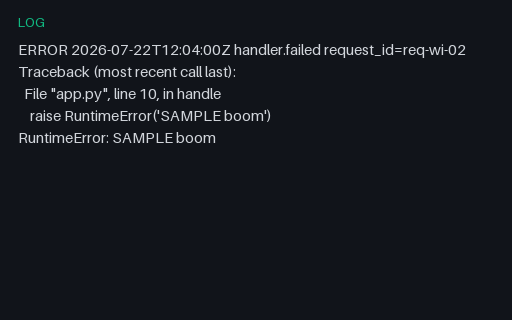
Tiny SAMPLE log excerpt (multiline-stacktrace) for parser and alert-rule tests.
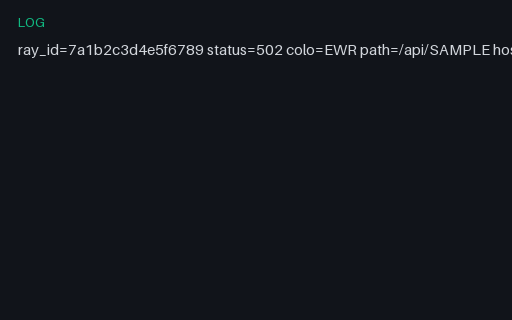
Tiny SAMPLE log excerpt (cloudflare-ray-sample) for parser and alert-rule tests.
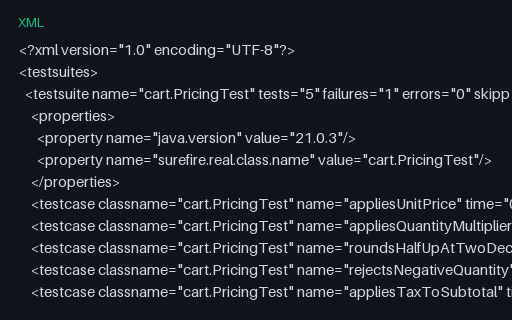
The same 12-case Novus Checkout run written the way maven-surefire 3.2 writes it. Maven Surefire merges its per-class files under a <testsuites> root and adds a <properties> block plus system-out/system-err on every suite. All eight dialect files in this group report 12 tests, 1 failure, 1 error and 1 skip, so a JUnit parser can be held to identical totals across every producer.
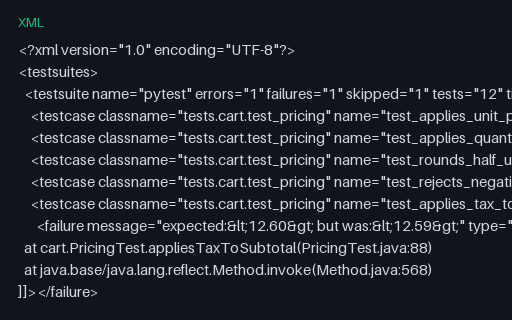
The same 12-case Novus Checkout run written the way pytest 8.2 --junitxml writes it. pytest emits a single <testsuite name="pytest"> whose classname is the dotted module path, and decorates each case with file and line attributes. All eight dialect files in this group report 12 tests, 1 failure, 1 error and 1 skip, so a JUnit parser can be held to identical totals across every producer.
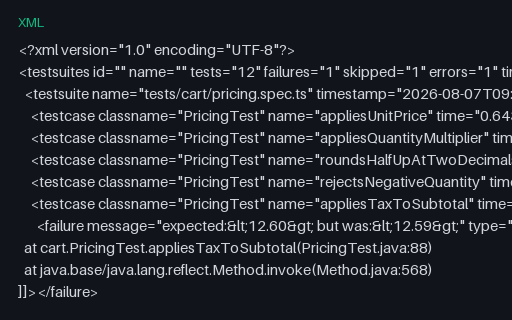
The same 12-case Novus Checkout run written the way @playwright/test 1.47 junit reporter writes it. Playwright puts the run totals on the <testsuites> root, names each suite after its spec file, and uses the bare describe title as classname. All eight dialect files in this group report 12 tests, 1 failure, 1 error and 1 skip, so a JUnit parser can be held to identical totals across every producer.
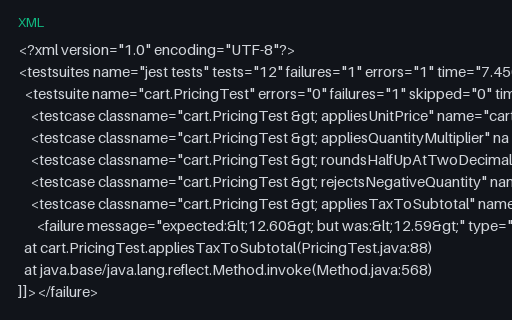
The same 12-case Novus Checkout run written the way jest-junit 16 writes it. jest-junit repeats the whole "describe > it" title in both classname and name, which breaks dashboards that assume classname is a package. All eight dialect files in this group report 12 tests, 1 failure, 1 error and 1 skip, so a JUnit parser can be held to identical totals across every producer.
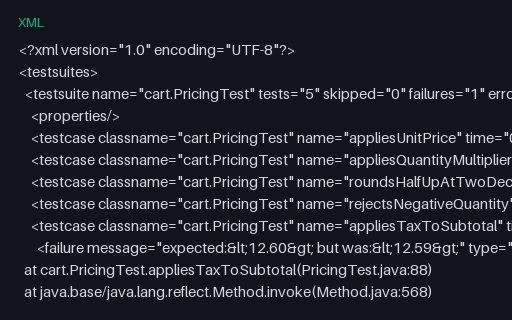
The same 12-case Novus Checkout run written the way Gradle 8.9 Test task writes it. Gradle writes hostname and timestamp on every suite and an empty self-closing <properties/> element that some parsers mishandle. All eight dialect files in this group report 12 tests, 1 failure, 1 error and 1 skip, so a JUnit parser can be held to identical totals across every producer.
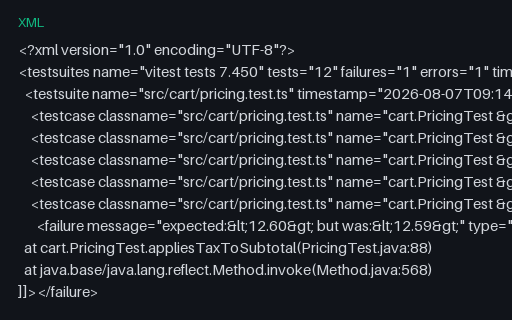
The same 12-case Novus Checkout run written the way vitest 2.0 junit reporter writes it. Vitest names the root suite after the elapsed time and uses the spec file path as classname for every case. All eight dialect files in this group report 12 tests, 1 failure, 1 error and 1 skip, so a JUnit parser can be held to identical totals across every producer.
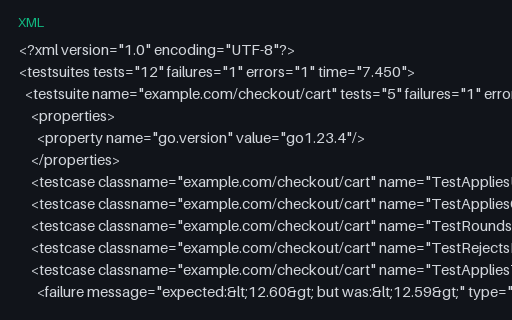
The same 12-case Novus Checkout run written the way go-junit-report 2.1 writes it. go-junit-report names each suite after a Go package and carries the toolchain version in a go.version property. All eight dialect files in this group report 12 tests, 1 failure, 1 error and 1 skip, so a JUnit parser can be held to identical totals across every producer.
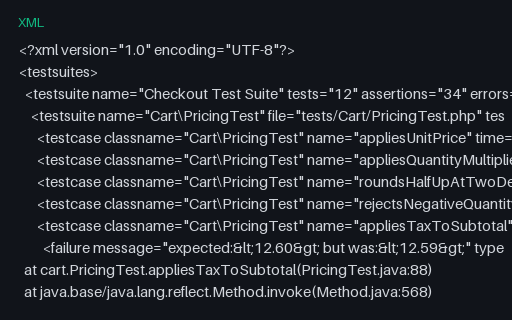
The same 12-case Novus Checkout run written the way PHPUnit 11.2 --log-junit writes it. PHPUnit nests per-class suites inside a named parent suite and adds an assertions count that no other dialect reports. All eight dialect files in this group report 12 tests, 1 failure, 1 error and 1 skip, so a JUnit parser can be held to identical totals across every producer.
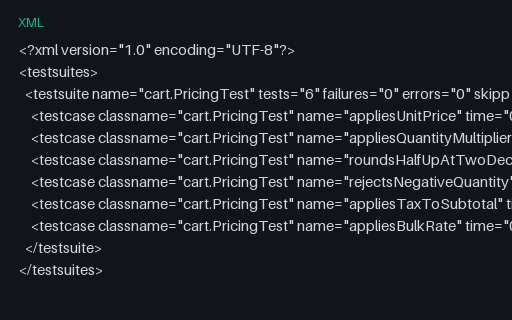
A clean green run: six passing cases, zero failures, errors and skips. The baseline a CI gate should treat as success, and the control case for any dashboard that colours a build from the failure count.
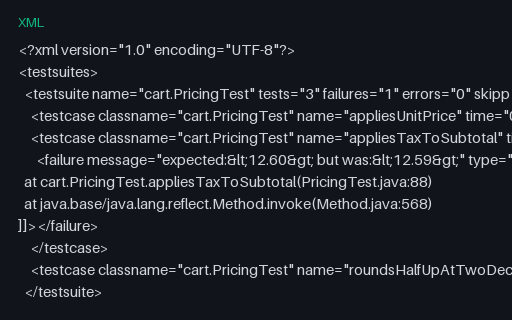
Three cases, one of them failing with an assertion message and a CDATA stack trace. The smallest report that must turn a build red, and the one to test a failure-summary renderer against.
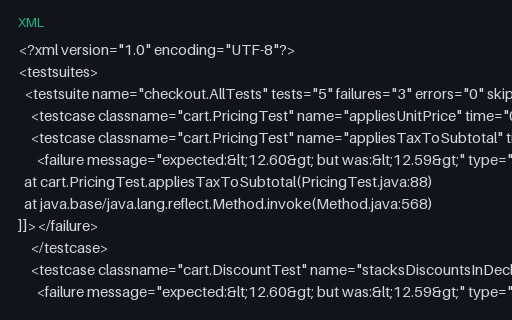
Three failures spread across three different classes in one suite. Use it to check that a reporter lists every failure rather than stopping at the first, and that it groups them by classname rather than by suite.
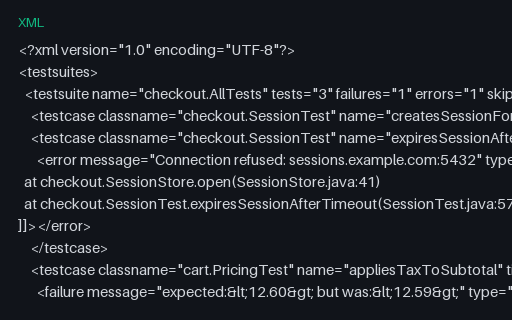
One <failure> (an assertion that did not hold) and one <error> (an exception the test never expected), side by side. Parsers that collapse the two lose the distinction between a broken assertion and a broken environment.
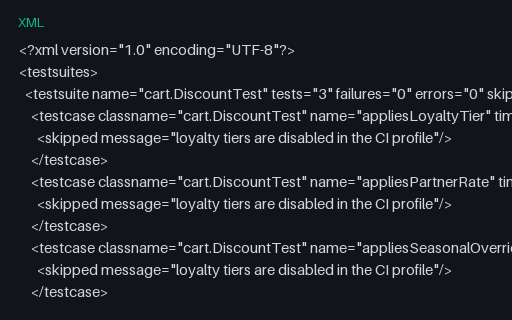
A suite in which every case was skipped, so tests equals skipped and nothing actually ran. A gate that reads only the failure count calls this green; one that checks executed>0 catches it.
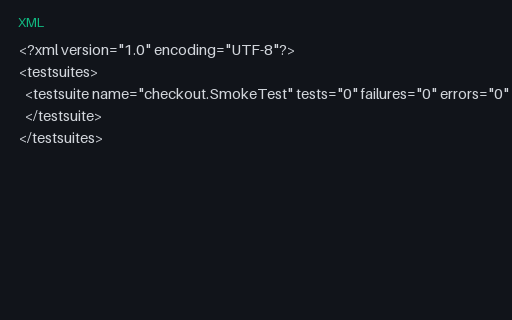
A structurally valid report containing a suite with no <testcase> children at all — what a runner writes when a filter matched nothing. Aggregators that divide by the test count to compute a pass rate hit a zero denominator here.
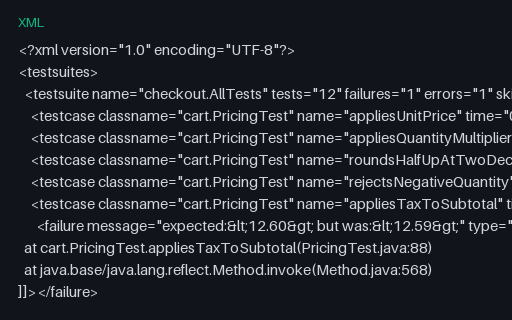
The full canonical run flattened into a single suite: nine passes, one failure, one error and one skip. This is the same twelve cases the eight dialect files carry, so totals can be compared straight across.
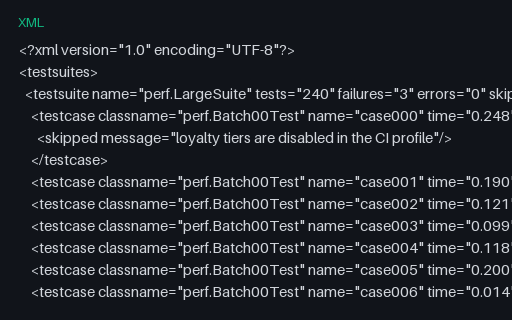
240 cases across six classes, three of them failing. Big enough to time a parser and to check that a report UI paginates or virtualises rather than rendering every row, but still small enough to read.
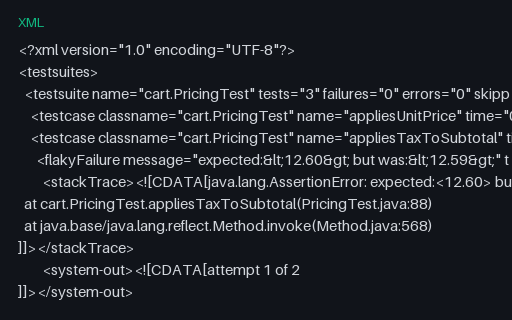
A case that failed on its first attempt and passed on the retry, recorded with Surefire's <flakyFailure> child. The suite counters say zero failures, so a parser that ignores the extension element reports a clean run and loses the flake entirely.
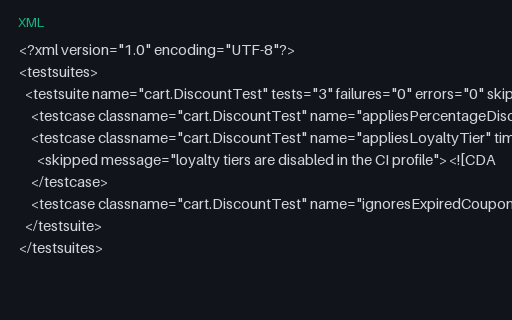
A skipped case whose reason appears twice — in the message attribute and again as CDATA text inside the <skipped> element. Reporters that read only the attribute silently drop the longer explanation.
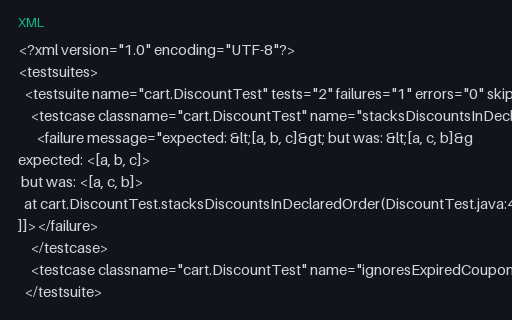
A failure whose message contains an expected/actual diff with angle brackets and newlines, the shape assertion libraries actually produce. Good for checking that a dashboard escapes the message for HTML and keeps its line breaks.
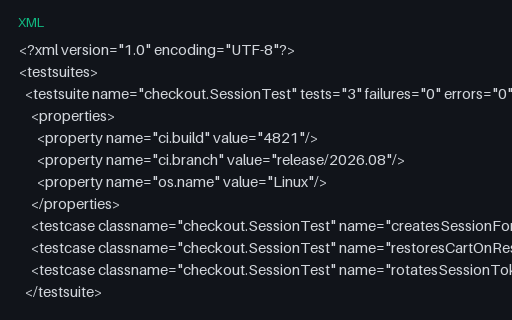
Every optional run-metadata attribute a JUnit suite may carry — timestamp, hostname, package, id — plus a properties block holding build and branch identifiers. Use it to test that a dashboard reads build context from the report instead of from its own environment.
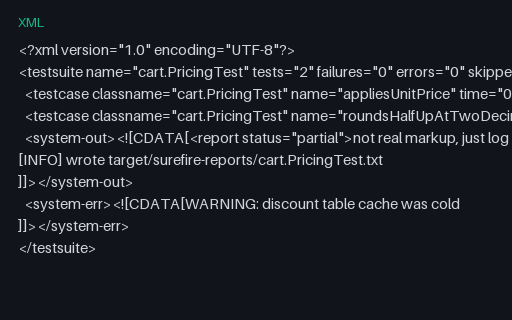
Captured stdout and stderr wrapped in CDATA, where the stdout text itself looks like XML markup. A parser must treat the CDATA content as opaque characters; one that re-parses it finds a <report> element that does not exist.
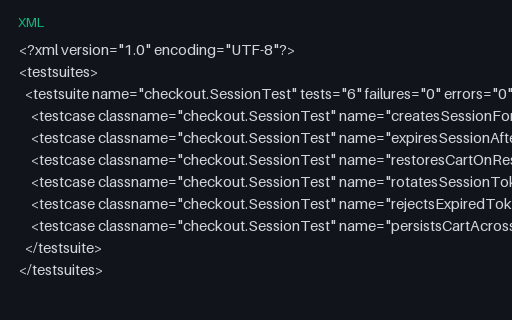
Build #101 of five consecutive runs of checkout.SessionTest, in which expiresSessionAfterTimeout is passing while the other five cases pass every time. The underlying cause is a 250 ms sleep racing the session expiry sweep. Read the whole family in build order to reproduce what a flake detector sees.
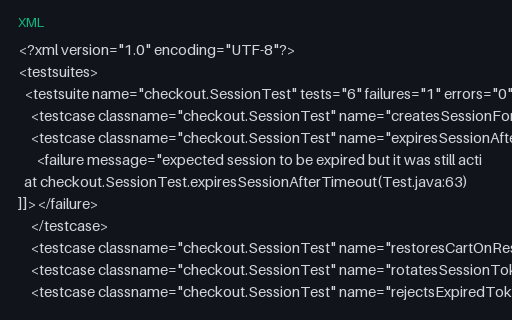
Build #102 of five consecutive runs of checkout.SessionTest, in which expiresSessionAfterTimeout is failing while the other five cases pass every time. The underlying cause is a 250 ms sleep racing the session expiry sweep. Read the whole family in build order to reproduce what a flake detector sees.
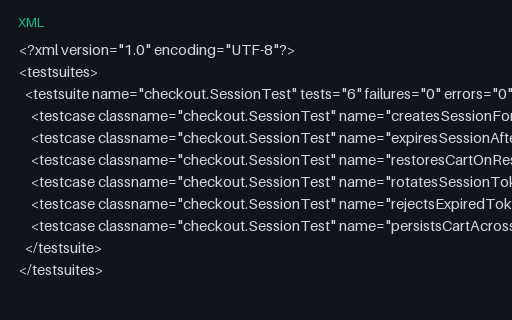
Build #103 of five consecutive runs of checkout.SessionTest, in which expiresSessionAfterTimeout is passing while the other five cases pass every time. The underlying cause is a 250 ms sleep racing the session expiry sweep. Read the whole family in build order to reproduce what a flake detector sees.
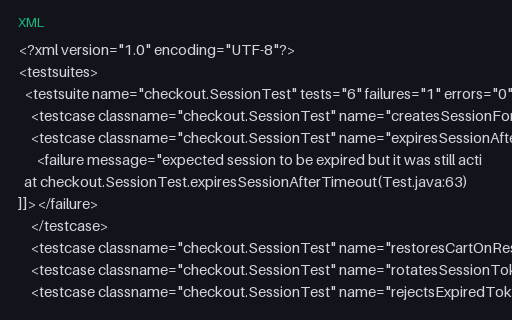
Build #104 of five consecutive runs of checkout.SessionTest, in which expiresSessionAfterTimeout is failing while the other five cases pass every time. The underlying cause is a 250 ms sleep racing the session expiry sweep. Read the whole family in build order to reproduce what a flake detector sees.
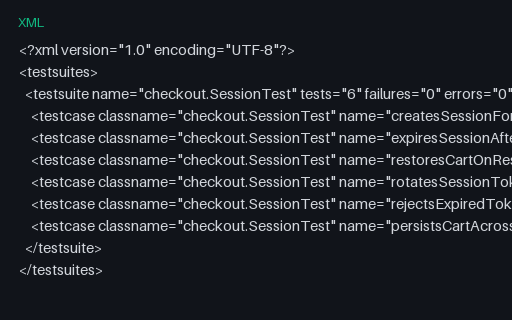
Build #105 of five consecutive runs of checkout.SessionTest, in which expiresSessionAfterTimeout is passing while the other five cases pass every time. The underlying cause is a 250 ms sleep racing the session expiry sweep. Read the whole family in build order to reproduce what a flake detector sees.
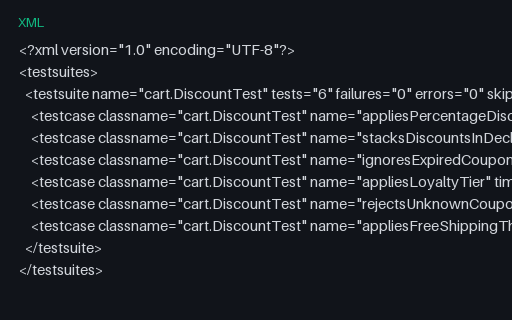
Build #201 of five consecutive runs of cart.DiscountTest, in which stacksDiscountsInDeclaredOrder is passing while the other five cases pass every time. The underlying cause is a shared coupon cache left populated by a sibling test under random ordering. Read the whole family in build order to reproduce what a flake detector sees.
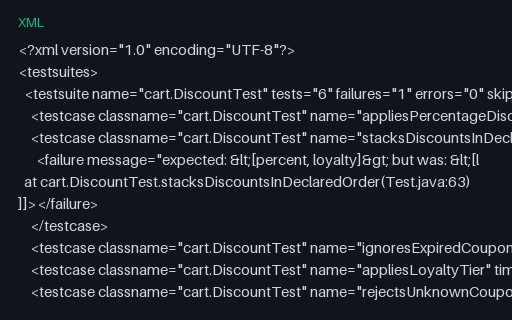
Build #202 of five consecutive runs of cart.DiscountTest, in which stacksDiscountsInDeclaredOrder is failing while the other five cases pass every time. The underlying cause is a shared coupon cache left populated by a sibling test under random ordering. Read the whole family in build order to reproduce what a flake detector sees.
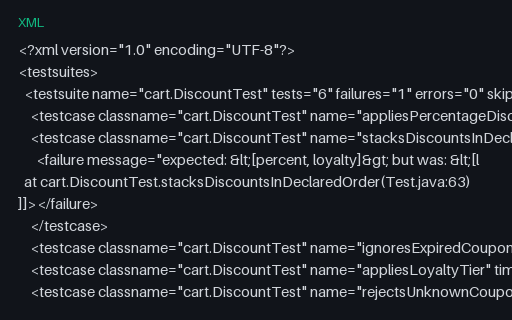
Build #203 of five consecutive runs of cart.DiscountTest, in which stacksDiscountsInDeclaredOrder is failing while the other five cases pass every time. The underlying cause is a shared coupon cache left populated by a sibling test under random ordering. Read the whole family in build order to reproduce what a flake detector sees.
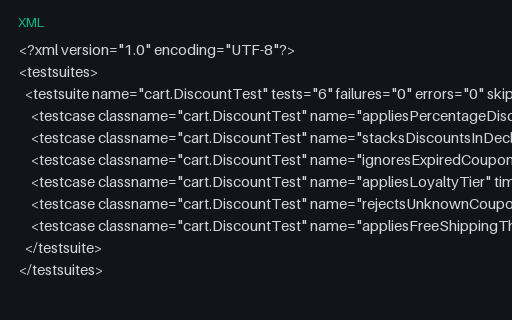
Build #204 of five consecutive runs of cart.DiscountTest, in which stacksDiscountsInDeclaredOrder is passing while the other five cases pass every time. The underlying cause is a shared coupon cache left populated by a sibling test under random ordering. Read the whole family in build order to reproduce what a flake detector sees.
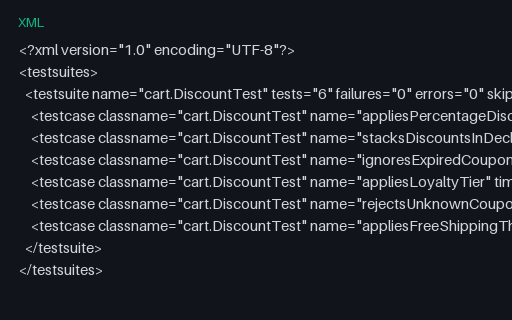
Build #205 of five consecutive runs of cart.DiscountTest, in which stacksDiscountsInDeclaredOrder is passing while the other five cases pass every time. The underlying cause is a shared coupon cache left populated by a sibling test under random ordering. Read the whole family in build order to reproduce what a flake detector sees.
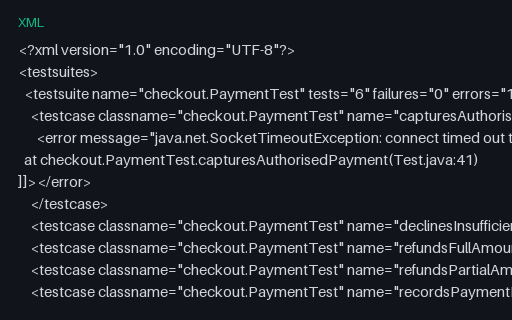
Build #301 of five consecutive runs of checkout.PaymentTest, in which capturesAuthorisedPayment is errored while the other five cases pass every time. The underlying cause is a real call to the fictional payments host instead of the stub. Read the whole family in build order to reproduce what a flake detector sees.
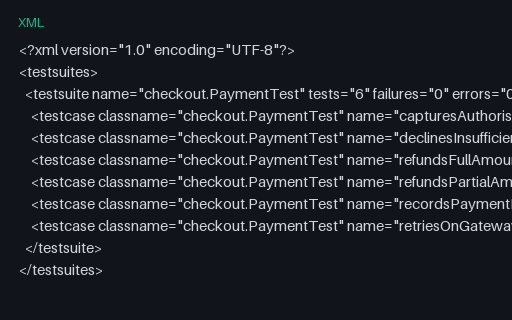
Build #302 of five consecutive runs of checkout.PaymentTest, in which capturesAuthorisedPayment is passing while the other five cases pass every time. The underlying cause is a real call to the fictional payments host instead of the stub. Read the whole family in build order to reproduce what a flake detector sees.
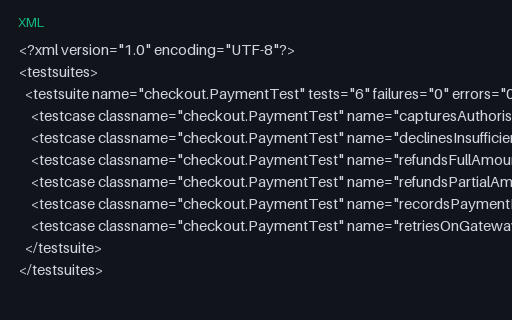
Build #303 of five consecutive runs of checkout.PaymentTest, in which capturesAuthorisedPayment is passing while the other five cases pass every time. The underlying cause is a real call to the fictional payments host instead of the stub. Read the whole family in build order to reproduce what a flake detector sees.
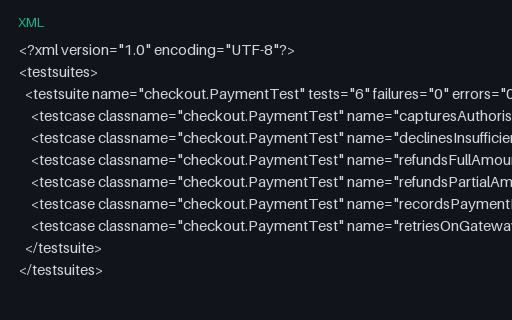
Build #304 of five consecutive runs of checkout.PaymentTest, in which capturesAuthorisedPayment is passing while the other five cases pass every time. The underlying cause is a real call to the fictional payments host instead of the stub. Read the whole family in build order to reproduce what a flake detector sees.
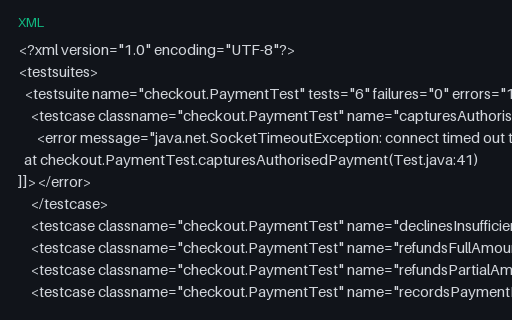
Build #305 of five consecutive runs of checkout.PaymentTest, in which capturesAuthorisedPayment is errored while the other five cases pass every time. The underlying cause is a real call to the fictional payments host instead of the stub. Read the whole family in build order to reproduce what a flake detector sees.
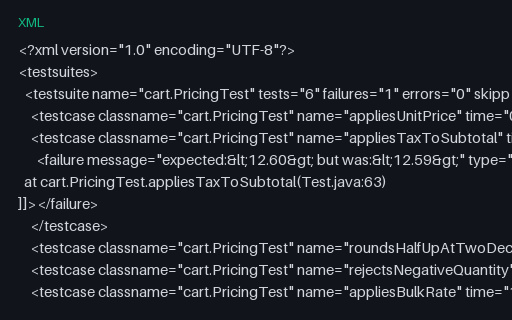
Build #401 of five consecutive runs of cart.PricingTest, in which appliesTaxToSubtotal is failing while the other five cases pass every time. The underlying cause is a rounding boundary that only trips when the tax rate table is reloaded. Read the whole family in build order to reproduce what a flake detector sees.
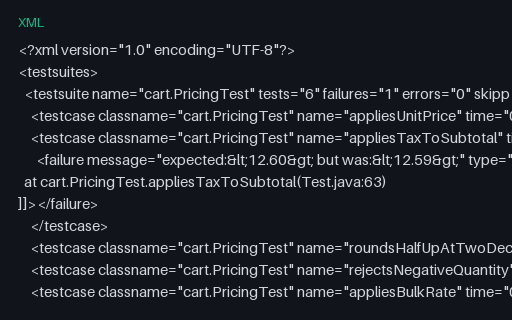
Build #402 of five consecutive runs of cart.PricingTest, in which appliesTaxToSubtotal is failing while the other five cases pass every time. The underlying cause is a rounding boundary that only trips when the tax rate table is reloaded. Read the whole family in build order to reproduce what a flake detector sees.
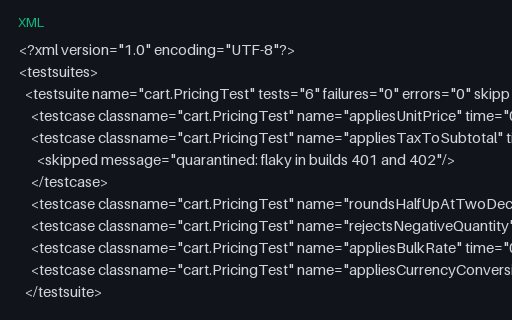
Build #403 of five consecutive runs of cart.PricingTest, in which appliesTaxToSubtotal is quarantined while the other five cases pass every time. The underlying cause is a rounding boundary that only trips when the tax rate table is reloaded. Read the whole family in build order to reproduce what a flake detector sees.
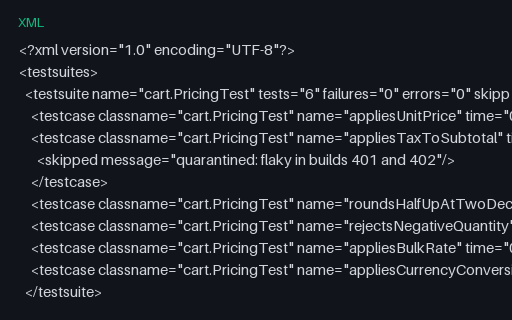
Build #404 of five consecutive runs of cart.PricingTest, in which appliesTaxToSubtotal is quarantined while the other five cases pass every time. The underlying cause is a rounding boundary that only trips when the tax rate table is reloaded. Read the whole family in build order to reproduce what a flake detector sees.
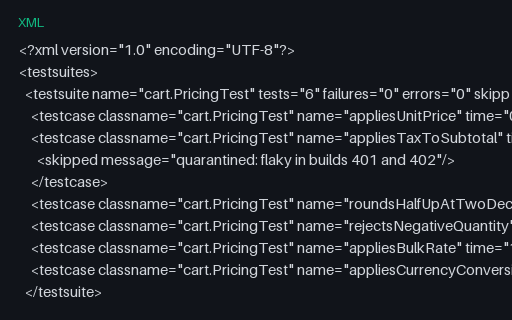
Build #405 of five consecutive runs of cart.PricingTest, in which appliesTaxToSubtotal is quarantined while the other five cases pass every time. The underlying cause is a rounding boundary that only trips when the tax rate table is reloaded. Read the whole family in build order to reproduce what a flake detector sees.
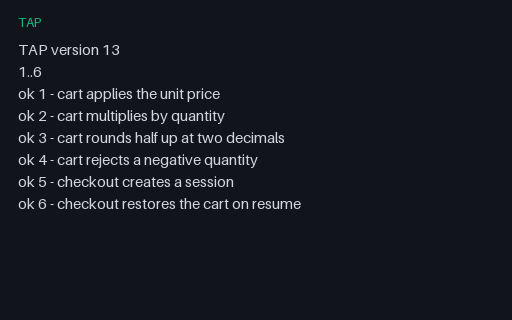
The canonical TAP shape: a version line, a leading plan, then six passing assertions in order. Anything a TAP consumer does with a real stream it must do with this one first.
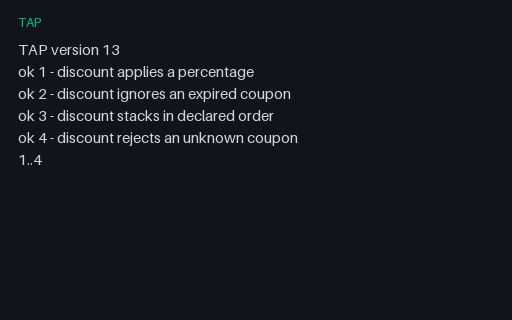
The same stream with the plan at the end, which is what a harness emits when it does not know the test count up front. A consumer that requires a leading plan rejects a perfectly valid stream.
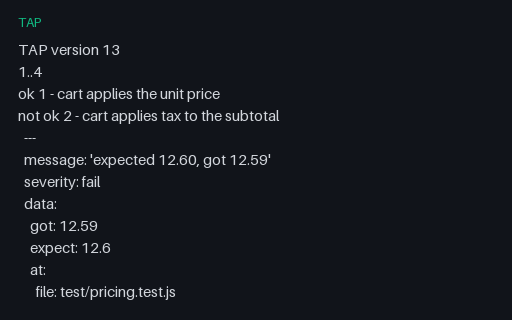
Two failing assertions, each followed by an indented YAML diagnostic block carrying the expected and actual values and a file/line location. The block is where every useful failure message in TAP lives, and it is the part naive line-based parsers throw away.
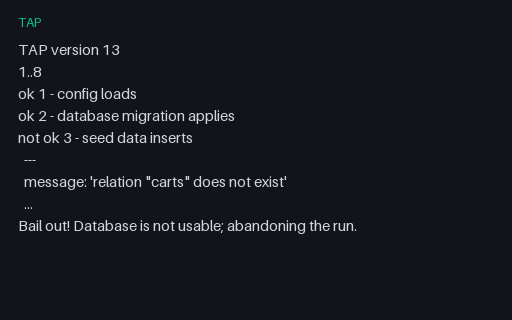
A run abandoned after the third assertion with a Bail out! line, leaving five of the planned eight assertions unreported. The run is a failure even though only one assertion said not ok, and a consumer must not report 2/3 passing as a 67% pass rate.
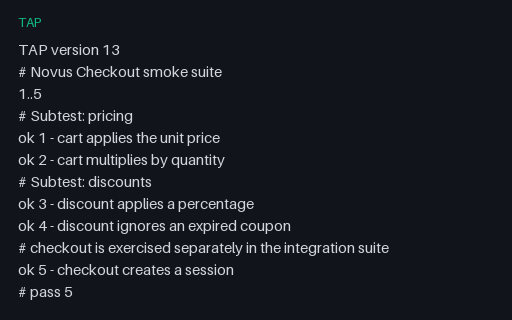
Free-form # comment lines interleaved with assertions, including a trailing summary block. Comments carry no result and must never shift assertion numbering, which is exactly what a parser counting lines instead of ok/not ok tokens gets wrong.
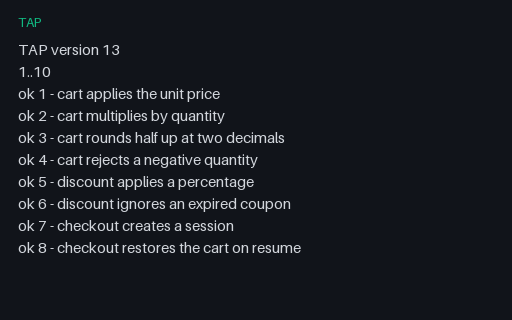
Every assertion in this stream says ok, but the plan promised ten and only eight arrived — the signature of a runner that crashed after its last reported assertion. A consumer that only counts not ok lines calls this a clean pass.
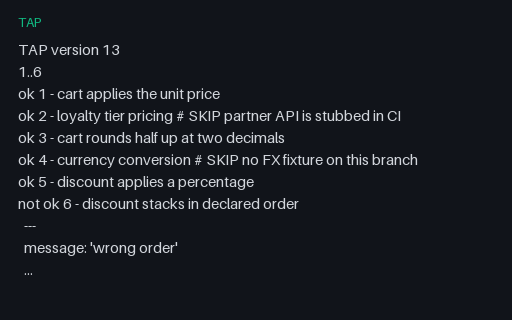
Two assertions marked # SKIP with a reason, alongside a genuine failure. Skipped assertions are written as ok, so counting ok lines reports 5 passes when only 3 tests actually ran.
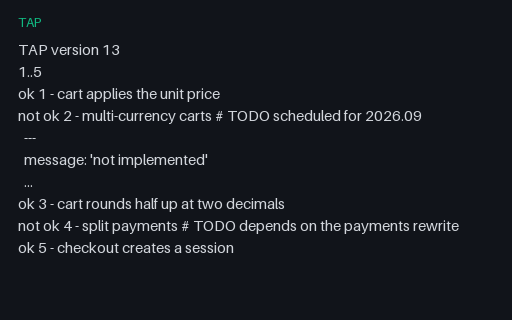
Two failing assertions marked # TODO, meaning they are known-unfinished work rather than regressions. A TODO failure must not fail the run, so a consumer that treats every not ok as a build breaker turns this green run red.
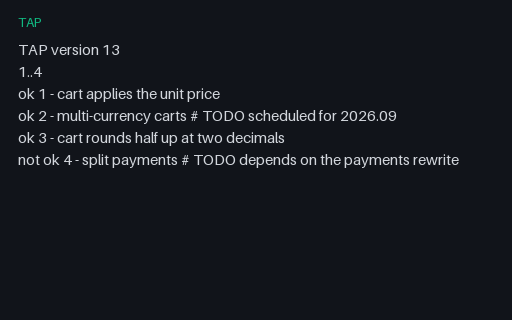
Assertion 2 is marked TODO but reports ok — an unexpected success, which means the feature landed and the marker is now stale. Harnesses such as prove report this as a bonus rather than a pass, and dropping the distinction lets stale TODOs accumulate forever.
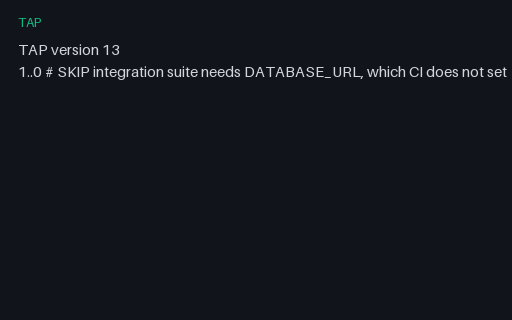
A whole suite declined in a single line: a zero-length plan with a SKIP directive and a reason. It is a valid, complete TAP stream containing no assertions, and a consumer must report it as skipped rather than as an empty pass or a parse error.
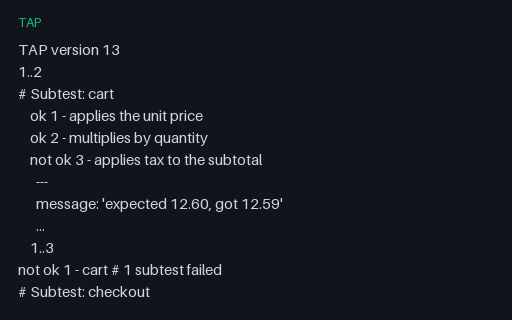
Two subtests, each an indented TAP stream with its own plan, rolled up into two top-level assertions. Flatten it and you count seven assertions instead of two; ignore the indentation and the nested failure is counted twice.
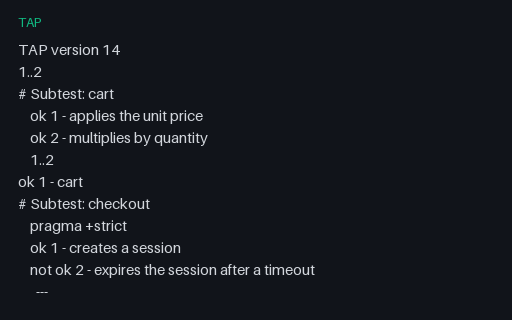
TAP 14 with an explicit version line and a pragma inside a subtest. Consumers pinned to version 13 either reject the stream outright or ignore the pragma, so this file separates the two behaviours.
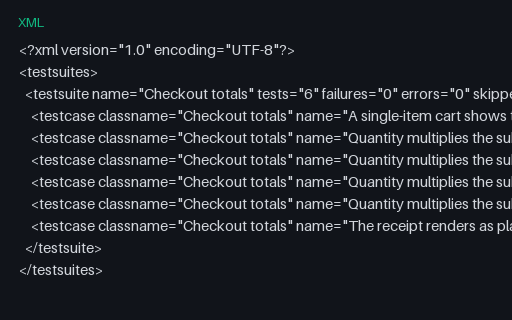
The same six pickles reported as JUnit XML, which is what a BDD suite hands to a generic CI dashboard. One <testcase> per pickle means the three expanded outline rows appear as three tests with identical names — enough to break any store keyed on name alone.
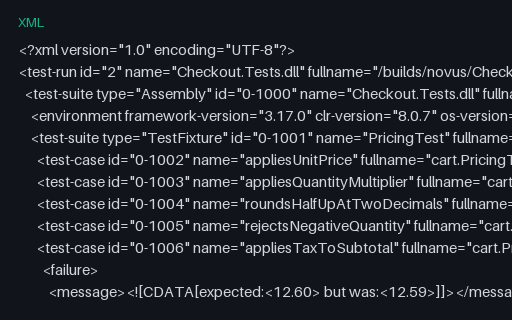
The NUnit 3 test-run document, with a nested Assembly/TestFixture suite tree, an environment element and per-case seeds. NUnit has no separate error outcome, so the errored case appears as Failed with label="Error" and the report reads failed=2. Reports the same canonical run as the JUnit dialect files: 12 tests, 9 passed, 1 assertion failure, 1 error and 1 skip.
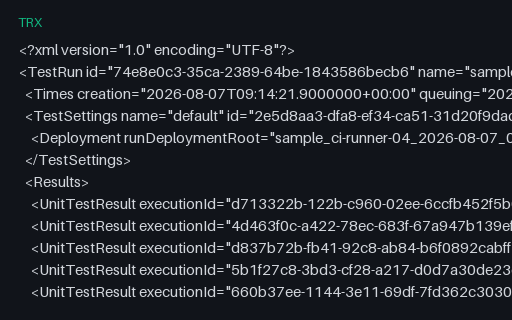
The `dotnet test` TRX document in full: Times, TestSettings, Results, TestDefinitions, TestEntries, TestLists and a ResultSummary with sixteen counters. Results and definitions are joined on GUIDs, so a converter that reads only <Results> loses every class name. Reports the same canonical run as the JUnit dialect files: 12 tests, 9 passed, 1 assertion failure, 1 error and 1 skip.
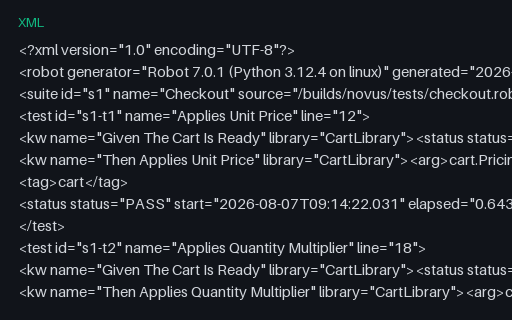
Robot Framework's output.xml, in which every keyword call carries its own status element and a trailing statistics section restates the totals by tag and by suite. Robot 7 reports elapsed seconds rather than the endtime attribute older versions used, so schemaversion is what a reader must branch on. Reports the same canonical run as the JUnit dialect files: 12 tests, 9 passed, 1 assertion failure, 1 error and 1 skip.
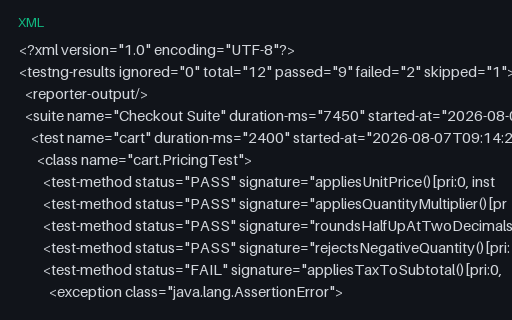
TestNG's own result document, with suite/test/class/test-method nesting, signature attributes and full stack traces in CDATA. TestNG has no error status, so the errored case is reported as FAIL and the header attributes read failed=2. Reports the same canonical run as the JUnit dialect files: 12 tests, 9 passed, 1 assertion failure, 1 error and 1 skip.
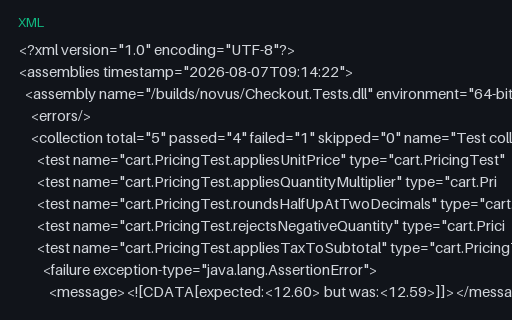
The xUnit.net v2 shape: an <assemblies> root holding one assembly, whose tests are grouped into collections rather than classes. Result values are Pass, Fail and Skip with capital initials, which trips converters doing a case-sensitive comparison against the lowercase values every other format uses. Reports the same canonical run as the JUnit dialect files: 12 tests, 9 passed, 1 assertion failure, 1 error and 1 skip.
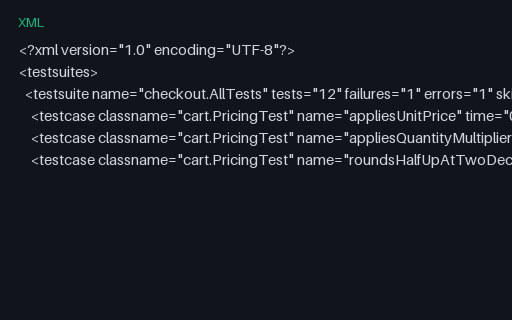
An intentionally corrupt JUnit report: the file ends in the middle of a testcase attribute value, exactly as it would if the CI worker were killed while the reporter was still writing. Three elements are left unclosed and the document is not well-formed XML. A parser must fail loudly rather than report the two complete cases as the whole run.
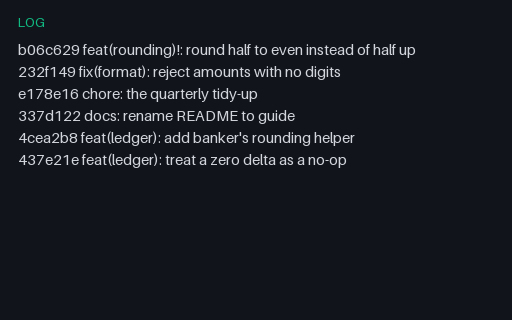
Six commits as `git log --oneline` prints them: an abbreviated hash, a space, and the subject line. Every subject follows Conventional Commits, including one with a `!` breaking marker, so a release-notes generator can be scored against a known answer.
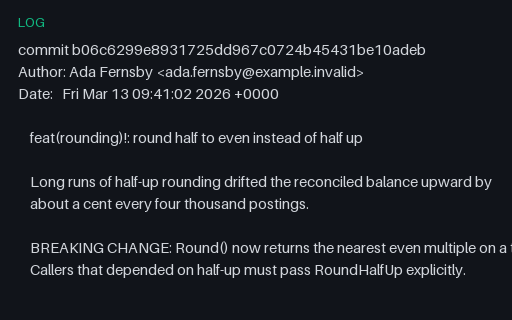
The default `git log` format for the same six commits: full 40-character hashes, Author and Date headers, and message bodies indented by exactly four spaces with genuinely empty separator lines. One commit carries a `BREAKING CHANGE:` footer and another a `Fixes:` footer, which is the shape a changelog generator has to find.
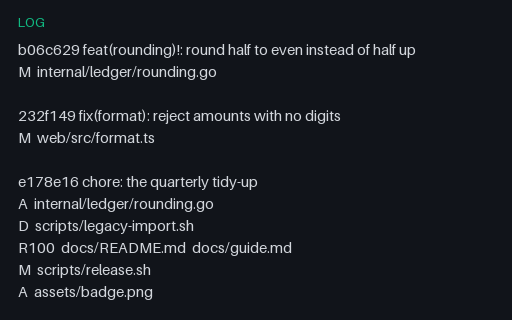
Per-commit file lists with single-letter status codes, tab-separated. Rename rows are the trap: `R100` is followed by TWO paths instead of one, so a splitter that takes field 2 as the filename reports the old path for renames and the new path for everything else.
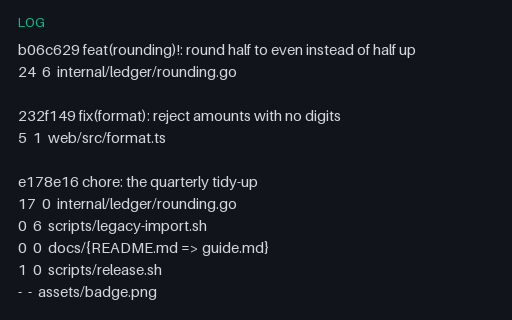
Machine-readable insertion and deletion counts per file. Two rows break naive arithmetic: the binary file reports `-` in both numeric columns rather than 0, and the rename path is brace-compressed into `docs/{README.md => guide.md}` rather than written out twice.
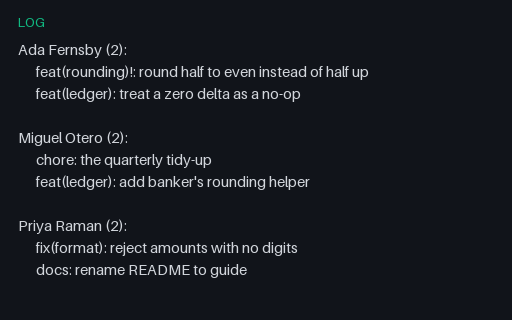
The author-grouped summary git generates for release notes: a name, a commit count in parentheses, and the subjects indented by six spaces. The counts here are what the .mailmap fixture in this category produces after coalescing aliases, so the two files can be used together.
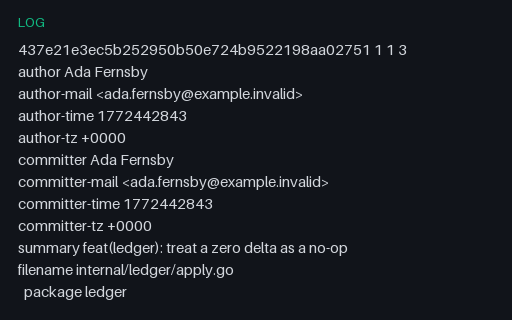
The stable machine format of git blame: a full header block the first time a commit appears and a bare `<sha> <old> <new>` line every time after, with each source line following on a tab-prefixed line. A parser that expects the header on every group loses the author of every line after the first.
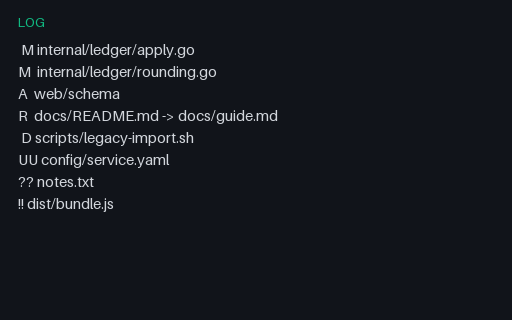
Porcelain v1 output covering staged-only, worktree-only, added, renamed, deleted, unmerged, untracked and ignored entries. The two status characters are positional and a space is meaningful, so trimming the line before parsing turns ' M' (modified but unstaged) into 'M' (staged).
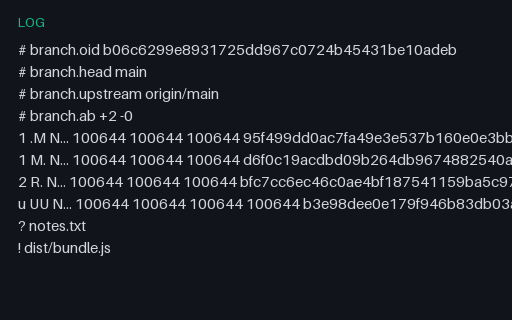
The v2 format for the same working tree: `# branch.*` headers first, then one record per entry whose leading character selects a completely different field layout. Rename records put the new path first and separate the two paths with a TAB rather than an arrow, and unmerged records carry three object ids instead of two.
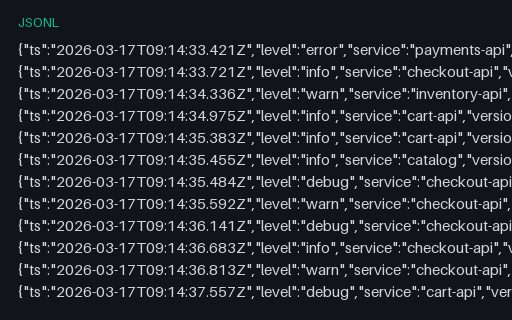
Three hundred newline-delimited JSON log records from five services, each with a timestamp, level, logger, message, a nested http object and request and order identifiers. The severity mix is counted in the spec table, so a level filter can be asserted rather than eyeballed.
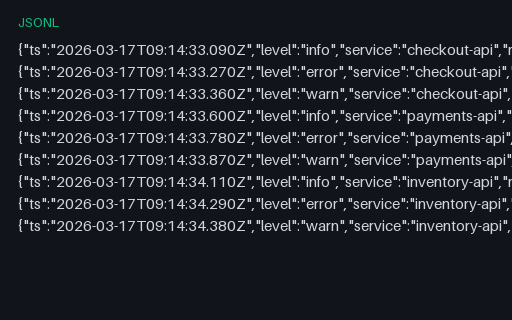
Java, Python and Go stack traces carried inside JSON string fields with their newlines escaped — the shape a structured logger produces, and the one that defeats multi-line joining rules written for plain text. Includes a Caused by chain and a goroutine dump.
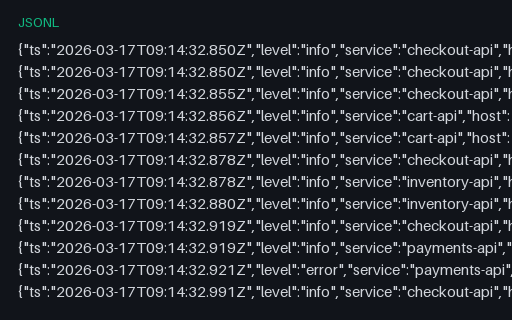
One log record per span of the canonical checkout trace, each carrying trace_id, span_id, parent_span_id and trace flags. The logs-to-traces jump with a target that actually exists in this catalog, so a correlation query can be verified end to end.
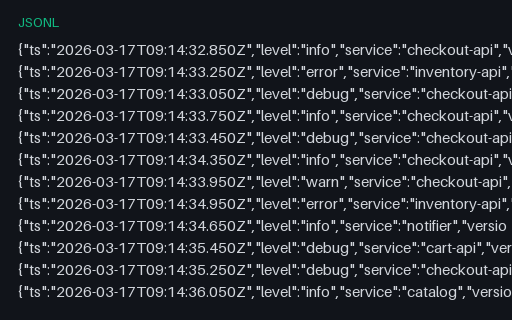
Records whose ts field moves backwards seven times while emitted_seq stays monotonic — what a buffered shipper produces when several workers flush concurrently. The fixture for sort-on-ingest, late-arrival windows and any index that assumes append order equals time order.
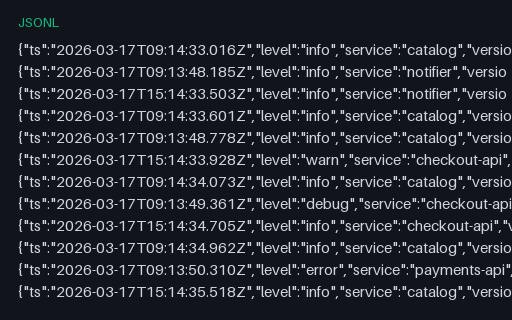
Three hosts writing to one stream with disagreeing clocks: one 45 seconds behind and one six hours ahead because NTP is unreachable. Interleaved by host, so a naive tail shows events from the future and a retention window silently drops the past.
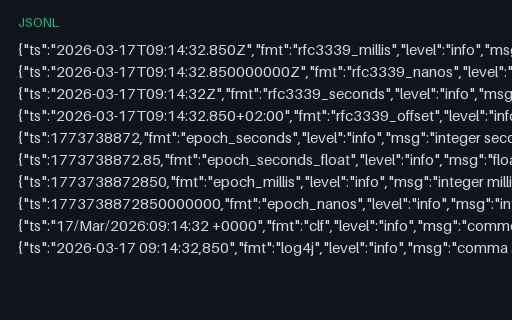
The same instant written ten ways — RFC 3339 at three precisions and with a non-UTC offset, epoch seconds as integer and float, epoch milliseconds and nanoseconds, Common Log Format and the log4j comma-decimal form. What a timestamp autodetector must resolve to one moment.
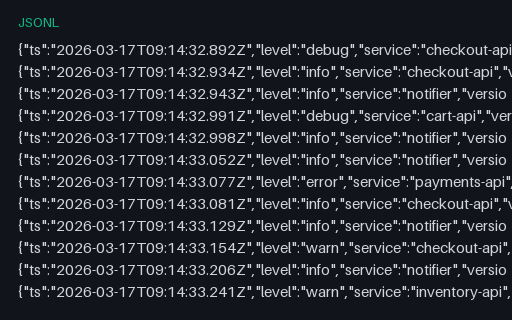
Every record carries five fields that are unique to it — session, customer, device, pod name and container ID. Harmless as log text, ruinous the moment they are promoted to indexed labels, which is the mistake this fixture exists to make measurable.
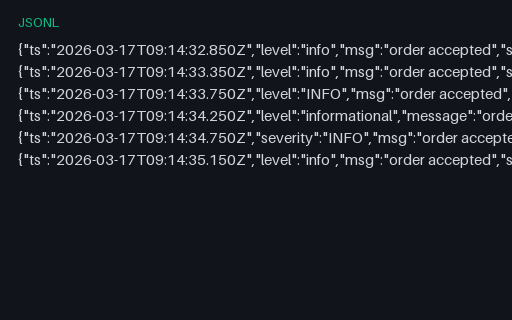
Six records that all mean the same thing and disagree about how to say it: status as a number, a string, a float and the text OK; user as a string, an object and null; tags as an array and a scalar; and the level and message fields renamed. The mapping conflict that stops an index mid-ingest.
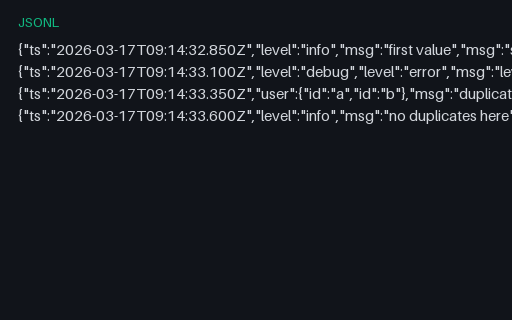
Records whose objects declare the same key twice, including one where the duplicate changes the severity from debug to error. RFC 8259 permits duplicate names and leaves the outcome undefined, so last-wins and first-wins parsers disagree about what these records say.
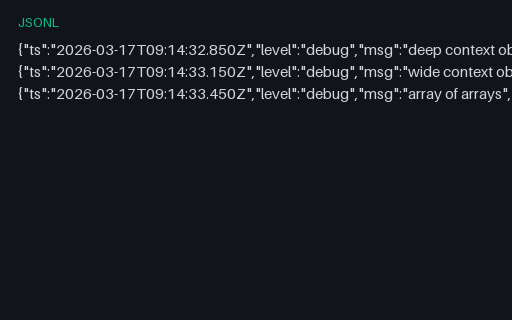
One record nested 24 levels deep, one with 200 sibling keys and one holding a 12 by 12 array of arrays. Field-flattening pipelines turn these into hundreds of dotted keys, and depth limits truncate them silently — this is where both behaviours become visible.
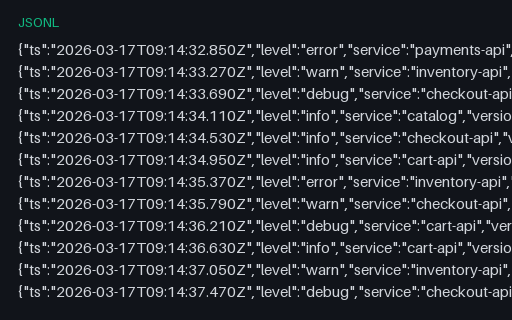
Twelve complete JSON records followed by a thirteenth cut off after 96 bytes with no trailing newline, exactly as a container log looks when the process is killed mid-write. Intentionally corrupt and small: a tailer must hold the partial line for a continuation rather than emit or discard it.
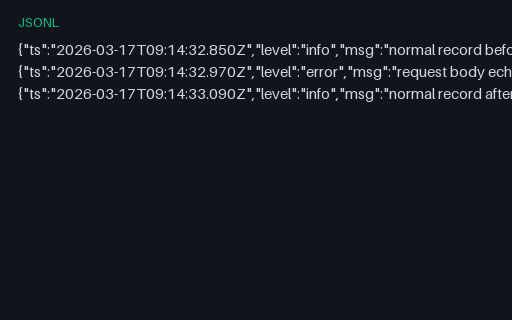
A single record of about 75 KB — a request body accidentally logged — sitting between two ordinary ones. Most shippers cap a line at 16 or 64 KB and either split it into invalid JSON fragments or drop the records around it; this file makes which one happen visible.
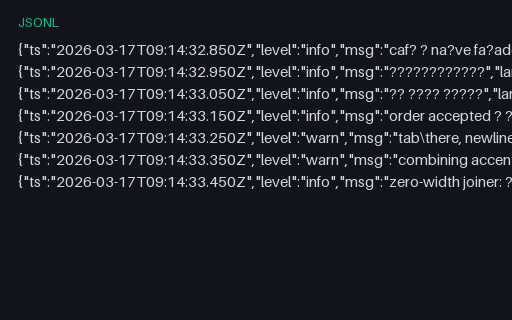
Log messages in Latin, Japanese and Arabic scripts, an emoji flag and a zero-width-joiner family, NFC and NFD forms of the same accented letter, and escaped tab, newline and carriage return. Everything that makes a log line's byte length and its display width disagree.
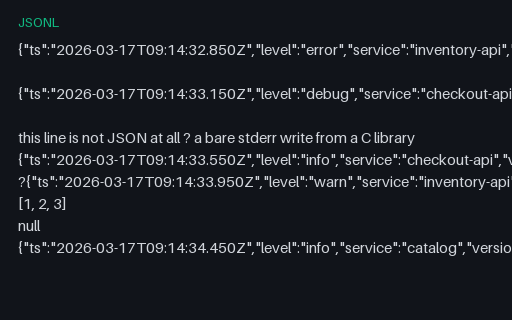
A JSON Lines file with the debris a real container stream carries: blank and whitespace-only lines, one bare stderr write from a C library, a mid-file byte-order mark and two lines that are valid JSON but not objects. Five real records are in there.
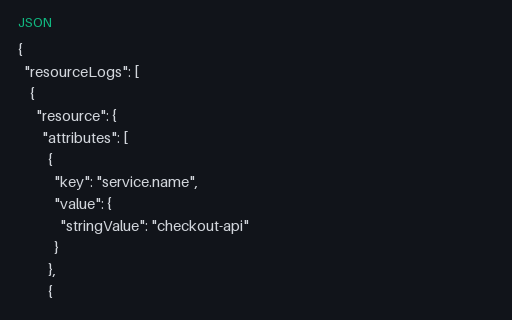
An OTLP logs export across two resources: five records spanning DEBUG to FATAL with both severityNumber and severityText, separate event and observed timestamps, trace and span correlation, and one record whose body is a full multi-line Python traceback.
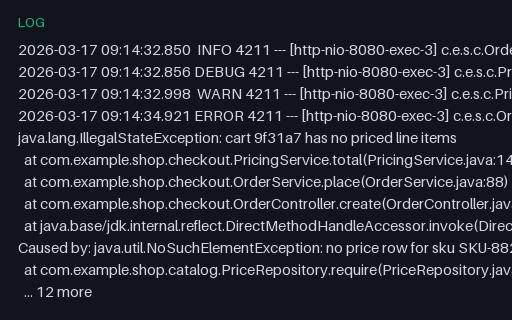
A Spring-style text log where two stack traces span many physical lines. Eight logical events across a larger number of lines, so a shipper's multi-line rule — anything not starting with a timestamp continues the previous event — can be scored against a known answer.
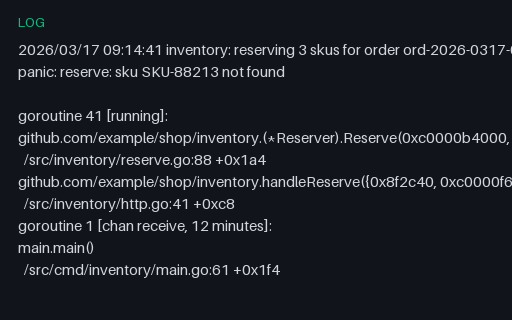
A Go panic followed by the runtime's full goroutine dump — four goroutines with their wait states, two-line frames and a created by attribution, separated by blank lines. Blank-line separation defeats multi-line rules that treat an empty line as the end of an event.
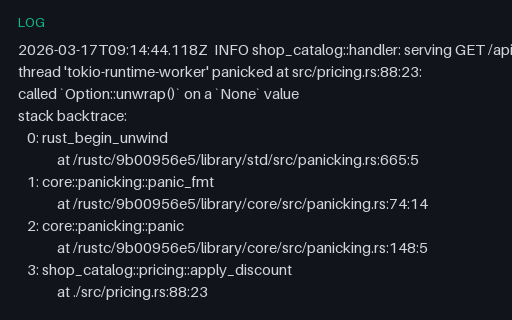
A Rust panic surrounded by ordinary tracing output: the panic location with line and column, a six-frame numbered backtrace where every frame spans two lines, and the RUST_BACKTRACE note. Frame numbering and the deep indent are what a generic stack parser gets wrong here.
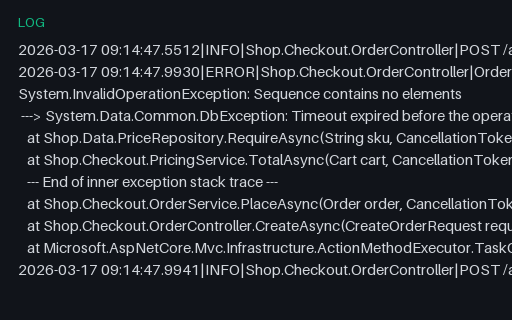
A .NET exception whose inner exception is introduced by the ---> marker and closed by End of inner exception stack trace, wrapped in pipe-delimited log lines. Error groupers that key on the outermost message alone merge two genuinely different faults here.
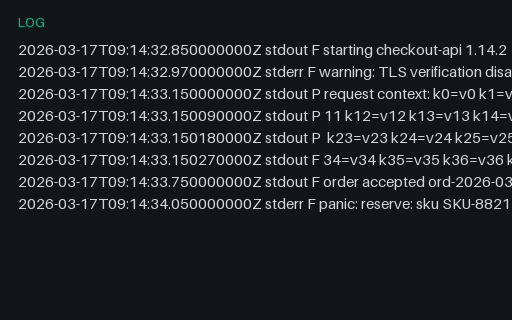
The CRI log format Kubernetes nodes actually write: an RFC 3339 nanosecond timestamp, a stream name, and an F or P tag marking whether the line is full or a partial continuation. One long message is split across several P lines that must be rejoined before parsing.
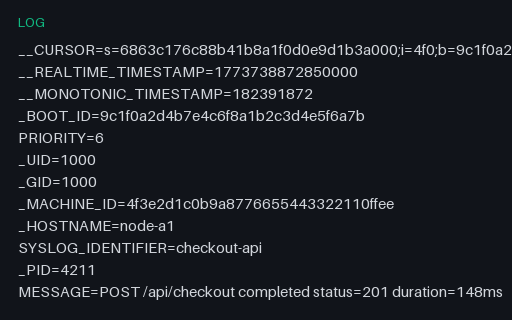
Five journal entries in systemd's export format — KEY=value lines separated by blank lines, with the double-underscore address fields, a syslog PRIORITY number rather than a level name, and microsecond timestamps. A parser must map priority 3 to error and 6 to info itself.
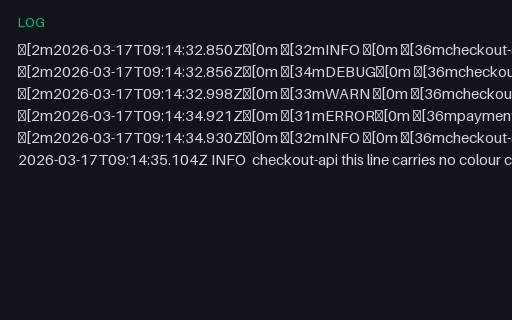
A developer-mode log where the level and service are wrapped in ANSI colour codes, ending with one uncoloured line. Colour codes sit inside the field a parser wants to read, so level extraction fails unless the sequences are stripped first — the classic symptom of a container run without a TTY check.
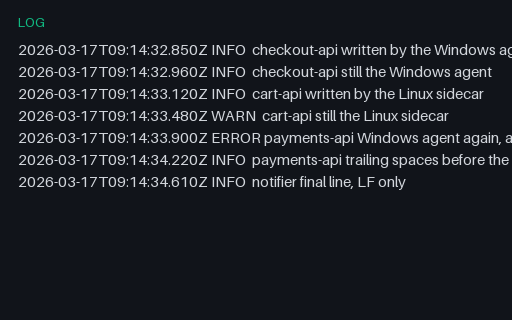
One log file written by two agents, four lines ending CRLF and three LF, with one line carrying trailing spaces before its break. Splitting on \n alone leaves a stray carriage return at the end of four fields, which is how a level or status ends up with an invisible character attached.
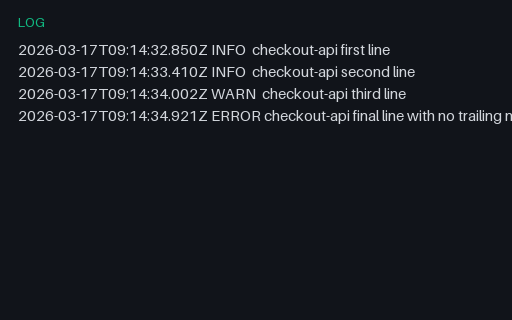
Four log lines where the last has no terminating newline — the normal state of any file still open for append. A tailer that only emits on seeing a newline holds that fourth line forever, which is why the newest error is the one missing from the dashboard.
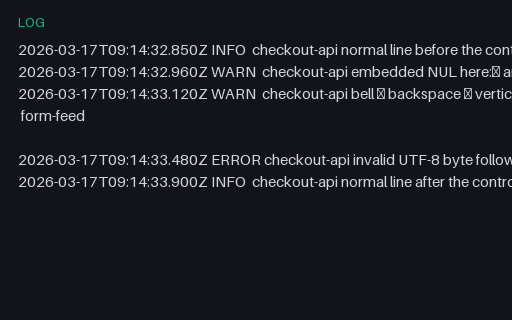
Five log lines carrying a NUL byte, bell, backspace, vertical tab and form feed, plus one 0xFF byte that is not valid UTF-8 — the debris that arrives when binary data reaches a log field. Deliberately contains no terminal-escape sequences, only inert control bytes.
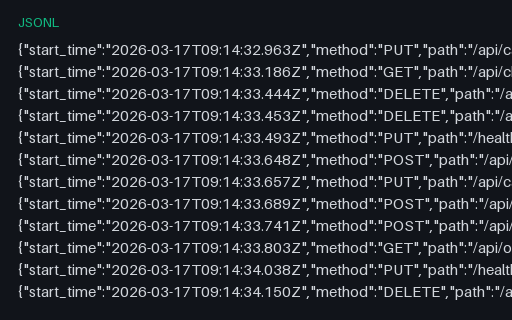
Forty service-mesh proxy access records with the fields that make mesh debugging possible: response_flags distinguishing an upstream failure from an overflow, upstream_service_time against total duration, upstream host and cluster, and a request ID for correlation.
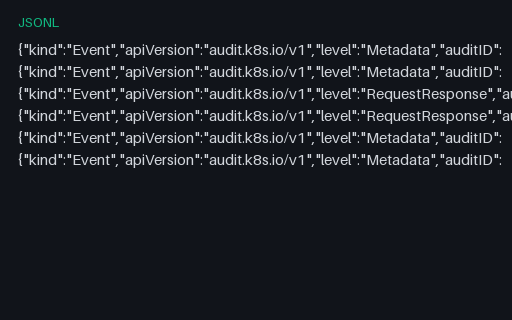
Six Kubernetes audit events at two audit levels, including one 403 whose authorization annotations record the forbid decision and its reason. The shape a cluster-audit alert or compliance report reads, with every user and service account invented.
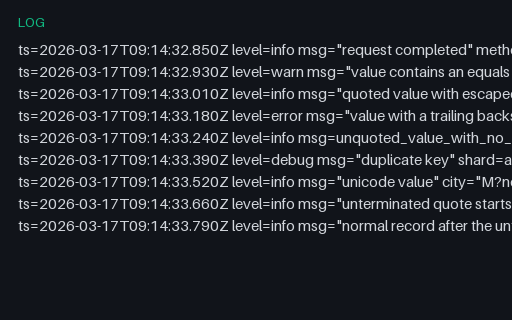
logfmt lines built to break naive splitting on spaces and equals signs: a value containing an equals sign, escaped quotes, a trailing backslash before the closing quote, a bare key with no value, duplicate keys, non-ASCII values and one unterminated quote followed by a clean line.
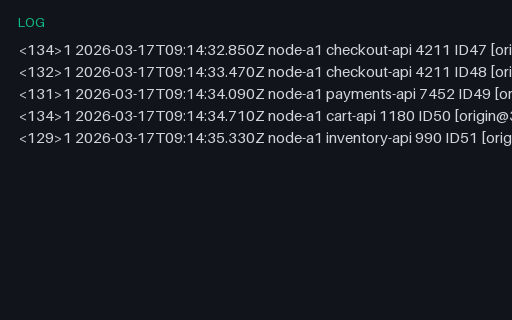
Five RFC 5424 syslog messages with the version digit, a full RFC 3339 timestamp and two structured-data elements per line — including one carrying the trace ID from this category's trace fixtures. The modern syslog most parsers still handle as if it were RFC 3164.
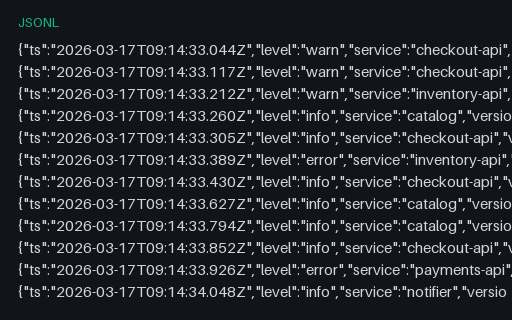
Logs that record their own sampling decision, with periodic dropped_since_last counters so the true event rate can be reconstructed from a sampled stream. Counting sampled records as if they were the whole population is the mistake this fixture is built to expose.
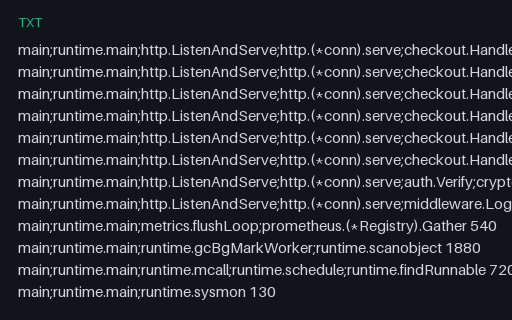
A CPU profile in the folded-stack format every flamegraph tool reads: one line per unique stack, frames separated by semicolons, then a space and a sample count. Twelve stacks up to seven frames deep, with the runtime's GC and scheduler work included as real profiles have.
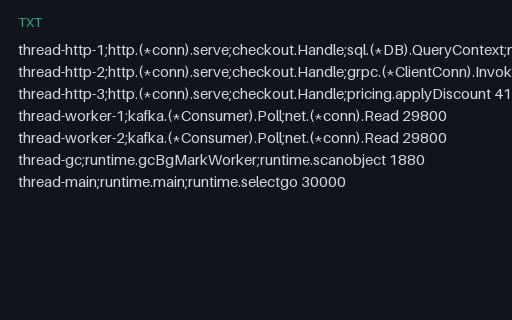
A 30-second wall-clock profile with the thread name as the root frame, so time blocked in reads is visible instead of invisible. Off-CPU time dominates — the shape that tells you a service is waiting, not computing, which a CPU profile alone cannot show.
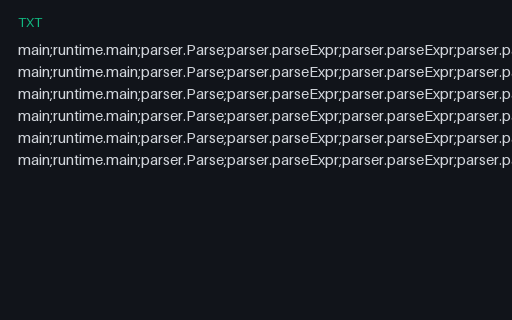
A recursive-descent parser profiled mid-recursion: stacks up to 204 frames deep where one frame repeats 200 times, on lines over 3,000 characters. Flamegraph renderers with a fixed depth limit truncate this silently, and line-length limits split it into nonsense.
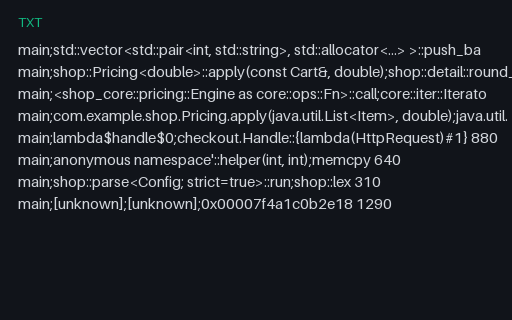
Demangled C++ templates, Rust trait impls, Java generics, lambdas and unresolved hex addresses in the folded format — including one symbol containing a semicolon, which the format has no way to escape. That line is genuinely ambiguous, and how a parser handles it is the point.
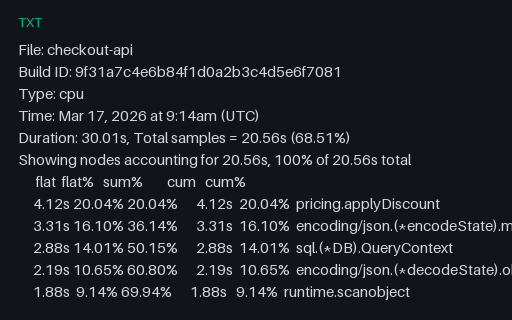
The text report pprof prints for the same profile as the folded fixtures: a metadata header, then flat and cumulative columns where frames that are never a leaf carry zero flat time and near-total cumulative time. Column-aligned output with a bare 0 rather than 0s, which is where naive column parsing fails.
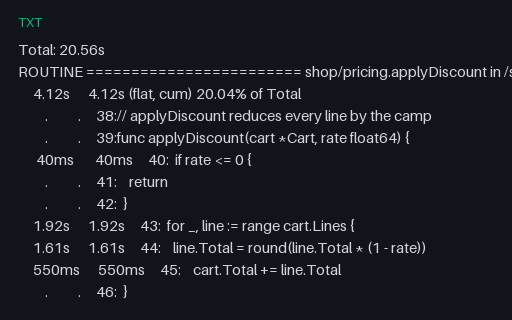
Line-level profile output: two routines with per-source-line flat and cumulative cost, a dot for lines that cost nothing, and units that switch between seconds and milliseconds within one column. Source lines keep their real tabs, which most column parsers do not survive.
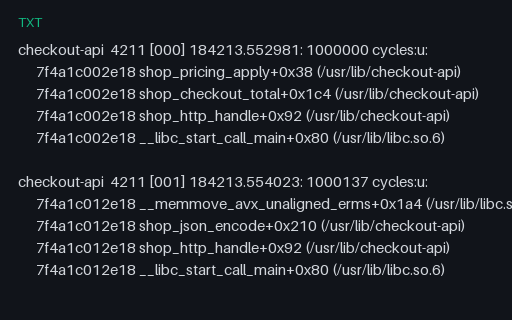
Raw perf script output — a header line per sample followed by tab-indented call-chain frames with addresses, symbols, offsets and DSO paths, samples separated by blank lines. The input side of stackcollapse, including unresolved frames a symbolizer could not name.
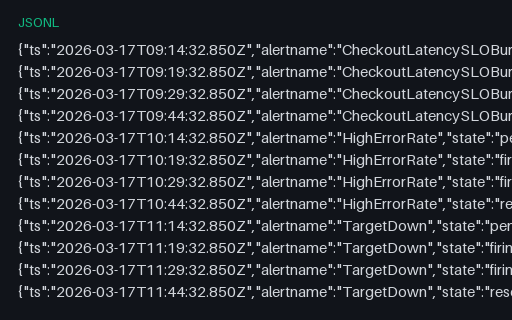
Sixteen state transitions across four alerts, each moving inactive to pending to firing to resolved with the previous state recorded. The pending stage is where a for: duration is being served and no notification is sent, which is what makes alert-noise analysis possible.
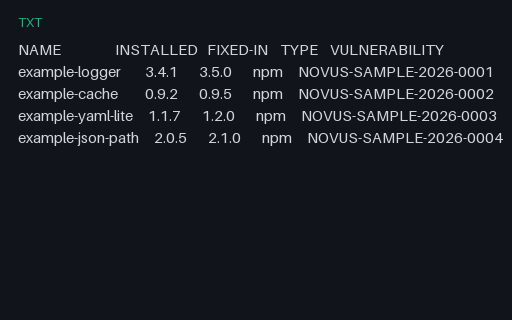
The console table a scanner prints, in fixed-width columns — the output people actually paste into tickets, and the one a log scraper has to parse without a delimiter. Advisory identifiers use the invented NOVUS-SAMPLE namespace with SAMPLE-CVE aliases; no identifier here refers to a published CVE, GHSA or OSV record, and no package named exists.
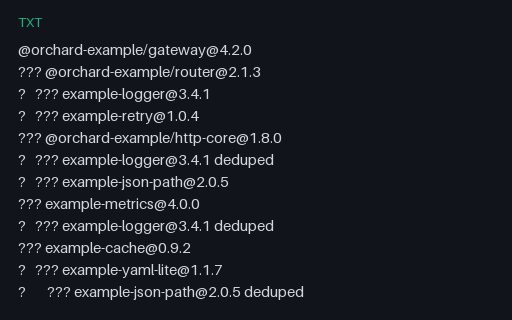
The console tree with box-drawing characters and `deduped` markers on repeat visits — the output people paste into issues, and a genuine test of whether a scraper handles non-ASCII tree glyphs. Every package, version, hash and licence is fictional — the tree describes nothing real.
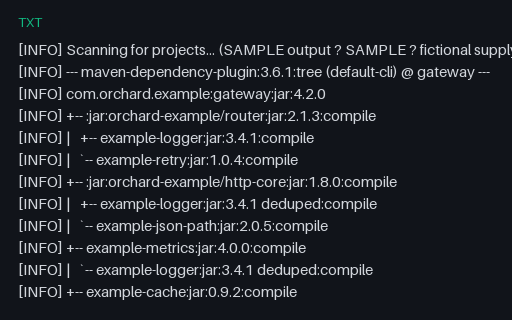
Maven's dependency tree, complete with the [INFO] log prefix that has to be stripped before the tree can be read and the five-part coordinate form Maven uses. Every package, version, hash and licence is fictional — the tree describes nothing real.
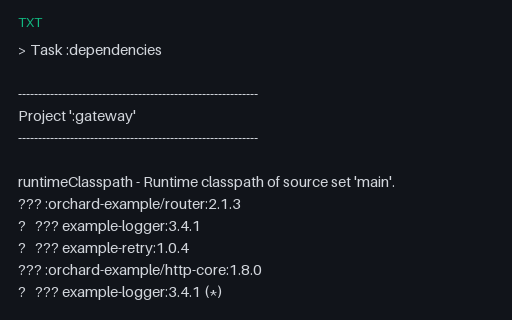
Gradle's dependency report, which marks repeat subtrees with `(*)` and explains the marker in a footer — so a parser has to resolve those references back to their first occurrence. Every package, version, hash and licence is fictional — the tree describes nothing real.
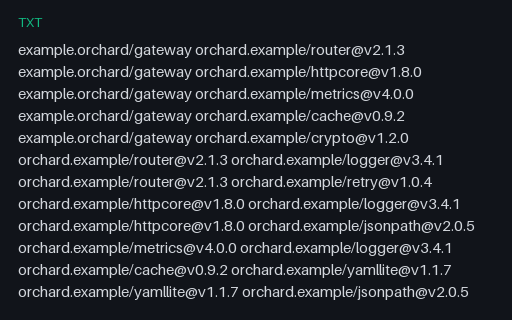
`go mod graph` output: a flat edge list, one `parent@version child@version` pair per line with no indentation at all — the simplest graph serialisation in this category and the easiest to diff. Every package, version, hash and licence is fictional — the tree describes nothing real.
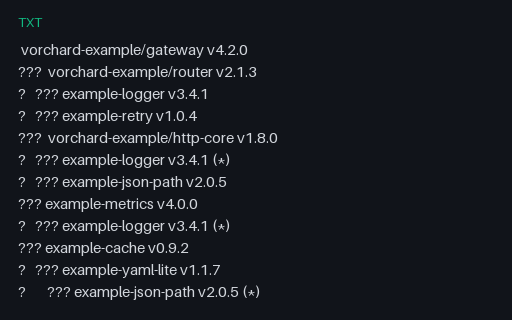
Cargo's tree output, which writes versions with a leading `v` and marks already-shown subtrees with `(*)` — close enough to npm's tree to fool a parser, different enough to break one. Every package, version, hash and licence is fictional — the tree describes nothing real.
We use Google Analytics and show ads via Adsterra. Non-essential cookies and ad scripts run only after you allow the matching categories. See our cookie policy.