
Wall-Clock Profile — Per-Thread Folded Stacks (txt)
A 30-second wall-clock profile with the thread name as the root frame, so time blocked in reads is visible instead of invisible. Off-CPU time dominates — the shape that tells you a service is waiting, not computing, which a CPU profile alone cannot show.
thread-http-1;http.(*conn).serve;checkout.Handle;sql.(*DB).QueryContext;net.(*conn).Read 28400
thread-http-2;http.(*conn).serve;checkout.Handle;grpc.(*ClientConn).Invoke;net.(*conn).Read 26100
thread-http-3;http.(*conn).serve;checkout.Handle;pricing.applyDiscount 4120
thread-worker-1;kafka.(*Consumer).Poll;net.(*conn).Read 29800
thread-worker-2;kafka.(*Consumer).Poll;net.(*conn).Read 29800
thread-gc;runtime.gcBgMarkWorker;runtime.scanobject 1880
thread-main;runtime.main;runtime.selectgo 30000
Specifications
- Stacks
- 7
- Threads
- 7
- Unit
- milliseconds
- Wall Window Ms
- 30000
- Blocked On Io Ms
- 114100
- On Cpu Ms
- 6000
- Root Is Thread Name
- true
Testing contract
Expected to pass- Scenario
- Render per-thread and separate on-CPU from blocked time.
- Expected result
- Seven thread roots render, the sum of net.(*conn).Read time exceeds the 30-second window because threads run in parallel, and only about 6 seconds is genuinely on-CPU.
What is a .txt file?
TXT is a plain-text file containing unformatted character data with no styling or structure beyond line breaks. Its interpretation depends on character encoding, most commonly UTF-8, and on line-ending convention. It is the most universal and portable text container.
How to use this file
Use an example TXT to test encoding detection, line-ending (LF versus CRLF) handling, and any tool that reads or streams raw text input.
How to use this file for testing
“Wall-Clock Profile — Per-Thread Folded Stacks (txt)” is a deterministic Novus Examples fixture for Observability, Performance testing, Log parsing. Structured and plain-text telemetry with known timestamps, levels, request identifiers, and error states for testing log ingestion, correlation, dashboards, and alert pipelines.
Documented properties for this file: TXT · 498 bytes. Compare results against paired or grouped companions on this page when present (clean↔damaged, searchable↔scanned, or format twins) so scores stay reproducible across runs.
Download the file once, keep the path stable in CI or local scripts, and treat the spec table as the contract: dimensions, seeds, field lists, and roles are intentional. Corrupt or invalid samples are labelled as such — expect parsers to fail loudly rather than silently accept them.
Telemetry fixtures use fixed trace IDs, span IDs, and timestamps so ingestion is reproducible run to run. Point your collector, parser, or query layer at the file and assert the documented span tree, metric families, or severity mix; service and host names are invented.
Related files
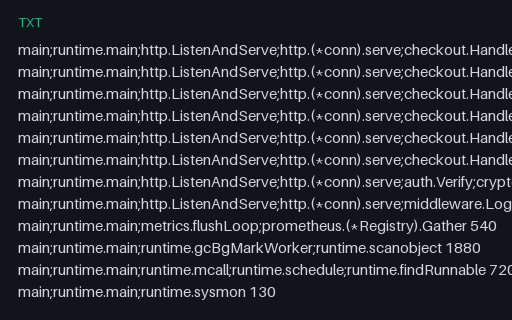
- txtCPU Profile — Folded Stacks, Baseline (txt)A CPU profile in the folded-stack format every flamegraph tool reads: one line per unique stack, frames separated by semicolons, then a space and a sample count. Twelve stacks up to seven frames deep, with the runtime's GC and scheduler work included as real profiles have.
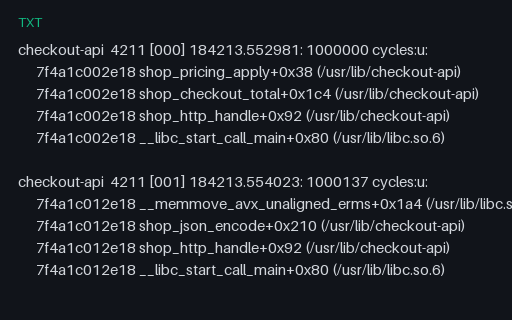
- txtLinux perf script — Sample Records with Call Chains (txt)Raw perf script output — a header line per sample followed by tab-indented call-chain frames with addresses, symbols, offsets and DSO paths, samples separated by blank lines. The input side of stackcollapse, including unresolved frames a symbolizer could not name.
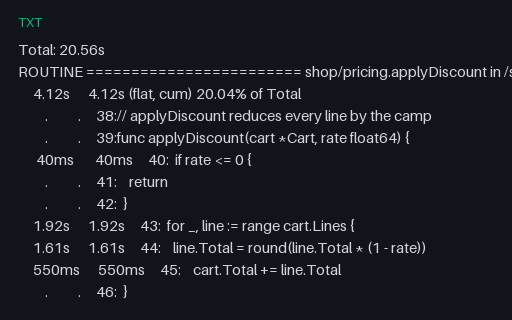
- txtpprof — Annotated Source Listing (txt)Line-level profile output: two routines with per-source-line flat and cumulative cost, a dot for lines that cost nothing, and units that switch between seconds and milliseconds within one column. Source lines keep their real tabs, which most column parsers do not survive.
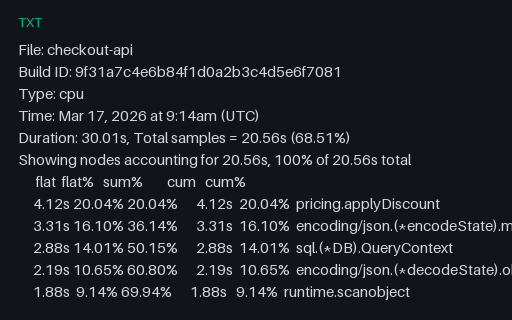
- txtpprof — Top Report Text Output (txt)The text report pprof prints for the same profile as the folded fixtures: a metadata header, then flat and cumulative columns where frames that are never a leaf carry zero flat time and near-total cumulative time. Column-aligned output with a bare 0 rather than 0s, which is where naive column parsing fails.
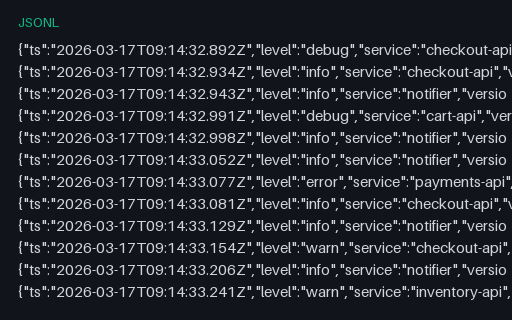
- jsonlStructured Log — High-Cardinality Label Fields (jsonl)Every record carries five fields that are unique to it — session, customer, device, pod name and container ID. Harmless as log text, ruinous the moment they are promoted to indexed labels, which is the mistake this fixture exists to make measurable.
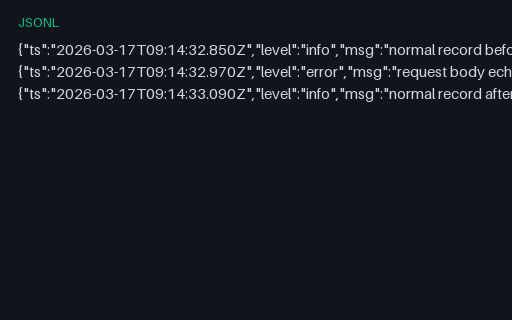
- jsonlStructured Log — One Oversized Record Between Normal Ones (jsonl)A single record of about 75 KB — a request body accidentally logged — sitting between two ordinary ones. Most shippers cap a line at 16 or 64 KB and either split it into invalid JSON fragments or drop the records around it; this file makes which one happen visible.
Generated by generation/observability.py. Free for any use, no attribution required — license.