
OTLP Logs — Export Document with Severity and Trace Correlation (json)
An OTLP logs export across two resources: five records spanning DEBUG to FATAL with both severityNumber and severityText, separate event and observed timestamps, trace and span correlation, and one record whose body is a full multi-line Python traceback.
{
  "resourceLogs": [
    {
      "resource": {
        "attributes": [
          {
            "key": "service.name",
            "value": {
              "stringValue": "checkout-api"
            }
          },
          {
            "key": "service.namespace",
            "value": {
              "stringValue": "shop"
            }
          },
          {
            "key": "service.version",
            "value": {
              "stringValue": "1.14.2"
            }
          },
          {
            "key": "service.instance.id",
            "value": {
              "stringValue": "checkout-api-7d9f4c-2xk"
            }
          },
          {
            "key": "deployment.environment.name",
            "value": {
              "stringValue": "staging"
            }
          },
          {
            "key": "host.name",
            "value": {
              "stringValue": "node-a1"
            }
          },
          {
            "key": "host.ip",
            "value": {
              "stringValue": "192.0.2.11"
            }
          },
          {
            "key": "cloud.region",
"value": {Specifications
- Log Records
- 5
- Resources
- 2
- Severity Levels
- DEBUG, INFO, WARN, ERROR, FATAL
- Trace Correlated Records
- 4
- Multiline Body Records
- 1
- Has Observed Time
- true
- Severity Numbers
- 5, 9, 13, 17, 21
Testing contract
Expected to pass- Scenario
- Decode the export and map severityNumber onto your own level scale.
- Expected result
- Five records decode with numbers 5, 9, 13, 17 and 21 mapping to DEBUG through FATAL, four carry a resolvable trace and span ID, and observedTimeUnixNano is 1.2 ms after timeUnixNano on every record.
What is a .json file?
JSON (JavaScript Object Notation) is a lightweight, text-based data-interchange format representing objects, arrays, strings, numbers, booleans, and null. It is language-independent, human-readable, and the dominant format for web APIs and configuration. It requires a single well-formed root value.
How to use this file
Use an example JSON file to test parsers and serializers, schema validation, Unicode and number-precision handling, and API request or response processing.
How to use this file for testing
“OTLP Logs — Export Document with Severity and Trace Correlation (json)” is a deterministic Novus Examples fixture for Observability, JSON parsing, Log parsing. Structured and plain-text telemetry with known timestamps, levels, request identifiers, and error states for testing log ingestion, correlation, dashboards, and alert pipelines.
Documented properties for this file: JSON · 9,144 bytes. Compare results against paired or grouped companions on this page when present (clean↔damaged, searchable↔scanned, or format twins) so scores stay reproducible across runs.
Download the file once, keep the path stable in CI or local scripts, and treat the spec table as the contract: dimensions, seeds, field lists, and roles are intentional. Corrupt or invalid samples are labelled as such — expect parsers to fail loudly rather than silently accept them.
Telemetry fixtures use fixed trace IDs, span IDs, and timestamps so ingestion is reproducible run to run. Point your collector, parser, or query layer at the file and assert the documented span tree, metric families, or severity mix; service and host names are invented.
Code examples
import json

with open("otlp-logs.json") as f:
    data = json.load(f)
print(type(data), len(data))
Related files
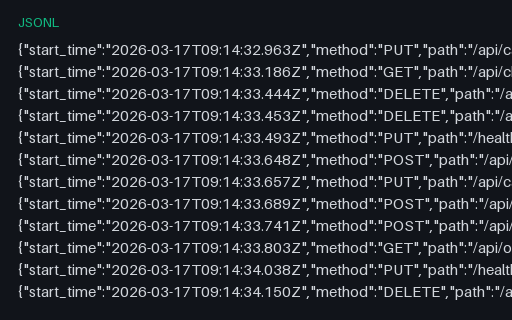
- jsonlEnvoy-Style Proxy Access Log — JSON Lines (jsonl)Forty service-mesh proxy access records with the fields that make mesh debugging possible: response_flags distinguishing an upstream failure from an overflow, upstream_service_time against total duration, upstream host and cluster, and a request ID for correlation.
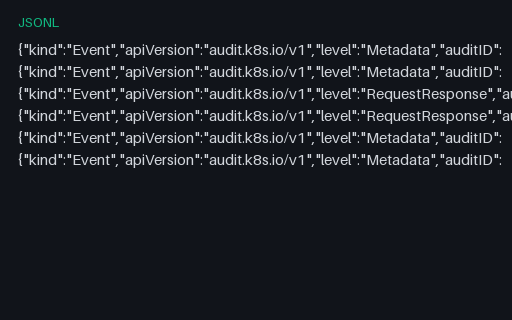
- jsonlKubernetes Audit Log — Six Events with an RBAC Denial (jsonl)Six Kubernetes audit events at two audit levels, including one 403 whose authorization annotations record the forbid decision and its reason. The shape a cluster-audit alert or compliance report reads, with every user and service account invented.
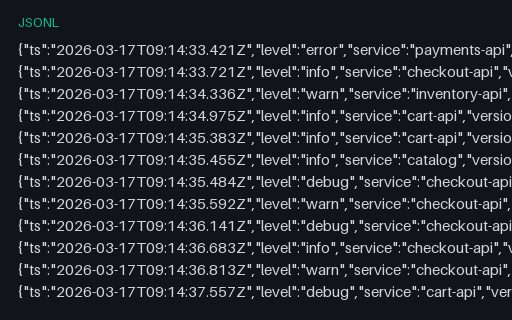
- jsonlStructured Application Log — 300 JSON Lines (jsonl)Three hundred newline-delimited JSON log records from five services, each with a timestamp, level, logger, message, a nested http object and request and order identifiers. The severity mix is counted in the spec table, so a level filter can be asserted rather than eyeballed.
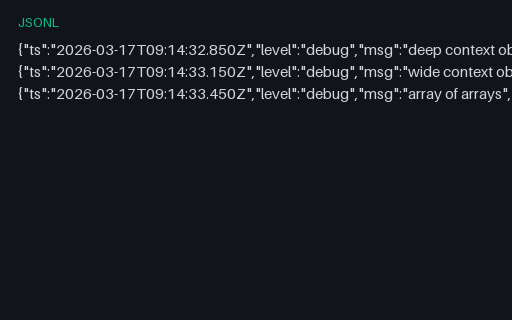
- jsonlStructured Log — Deeply Nested and Very Wide Context (jsonl)One record nested 24 levels deep, one with 200 sibling keys and one holding a 12 by 12 array of arrays. Field-flattening pipelines turn these into hundreds of dotted keys, and depth limits truncate them silently — this is where both behaviours become visible.
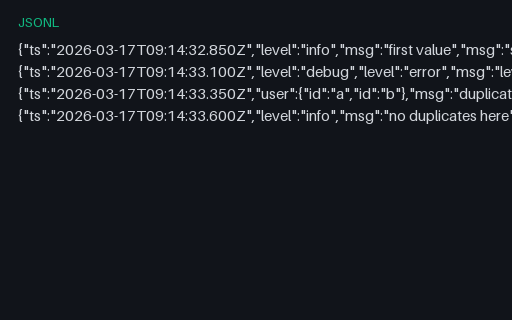
- jsonlStructured Log — Duplicate Keys in One JSON Object (jsonl)Records whose objects declare the same key twice, including one where the duplicate changes the severity from debug to error. RFC 8259 permits duplicate names and leaves the outcome undefined, so last-wins and first-wins parsers disagree about what these records say.
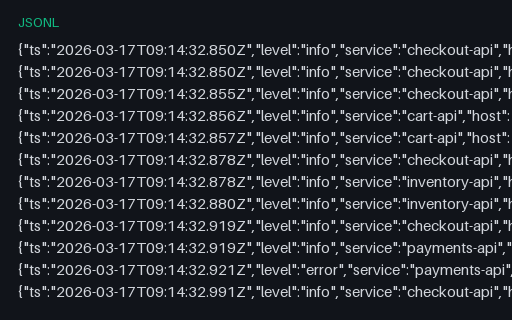
- jsonlStructured Log — Trace-Correlated Records (jsonl)One log record per span of the canonical checkout trace, each carrying trace_id, span_id, parent_span_id and trace flags. The logs-to-traces jump with a target that actually exists in this catalog, so a correlation query can be verified end to end.
Generated by generation/observability.py. Free for any use, no attribution required — license.