
Rust Panic with Numbered Backtrace (log)
A Rust panic surrounded by ordinary tracing output: the panic location with line and column, a six-frame numbered backtrace where every frame spans two lines, and the RUST_BACKTRACE note. Frame numbering and the deep indent are what a generic stack parser gets wrong here.
2026-03-17T09:14:44.118Z  INFO shop_catalog::handler: serving GET /api/catalog
thread 'tokio-runtime-worker' panicked at src/pricing.rs:88:23:
called `Option::unwrap()` on a `None` value
stack backtrace:
   0: rust_begin_unwind
             at /rustc/9b00956e5/library/std/src/panicking.rs:665:5
   1: core::panicking::panic_fmt
             at /rustc/9b00956e5/library/core/src/panicking.rs:74:14
   2: core::panicking::panic
             at /rustc/9b00956e5/library/core/src/panicking.rs:148:5
   3: shop_catalog::pricing::apply_discount
             at ./src/pricing.rs:88:23
   4: shop_catalog::handler::catalog
             at ./src/handler.rs:141:18
   5: tokio::runtime::task::harness::Harness<T,S>::poll
             at ./cargo/registry/tokio-1.44.0/src/runtime/task/harness.rs:157:15
note: Some details are omitted, run with `RUST_BACKTRACE=full` for a verbose backtrace.
2026-03-17T09:14:44.121Z ERROR shop_catalog::server: worker thread panicked, request aborted
Specifications
- Lines
- 18
- Frames
- 6
- Panic Location
- src/pricing.rs:88:23
- Two Line Frames
- true
- Has Note Line
- true
- Frame Pattern
- numbered symbol then indented at path:line:col
Testing contract
Expected to pass- Scenario
- Extract the panic event and its frames from the surrounding log lines.
- Expected result
- One event is produced containing all six numbered frames, the panic is attributed to src/pricing.rs:88:23, and the two ordinary tracing lines stay separate events.
What is a .log file?
LOG files are plain-text records of events emitted by software, typically one entry per line with a timestamp, severity, and message. There is no single standard, so formats range from unstructured text to structured JSON lines. They are central to debugging, monitoring, and auditing.
How to use this file
Use an example LOG file to test log parsers, timestamp and severity extraction, line-oriented streaming, and ingestion into monitoring or analysis pipelines.
How to use this file for testing
“Rust Panic with Numbered Backtrace (log)” is a deterministic Novus Examples fixture for Observability, Log parsing, Error handling. Structured and plain-text telemetry with known timestamps, levels, request identifiers, and error states for testing log ingestion, correlation, dashboards, and alert pipelines.
Documented properties for this file: LOG · 974 bytes. Compare results against paired or grouped companions on this page when present (clean↔damaged, searchable↔scanned, or format twins) so scores stay reproducible across runs.
Download the file once, keep the path stable in CI or local scripts, and treat the spec table as the contract: dimensions, seeds, field lists, and roles are intentional. Corrupt or invalid samples are labelled as such — expect parsers to fail loudly rather than silently accept them.
Telemetry fixtures use fixed trace IDs, span IDs, and timestamps so ingestion is reproducible run to run. Point your collector, parser, or query layer at the file and assert the documented span tree, metric families, or severity mix; service and host names are invented.
Code examples
grep -i error rust-panic-backtrace.log | head
awk '{print $1, $2, $NF}' rust-panic-backtrace.log | head
Related files
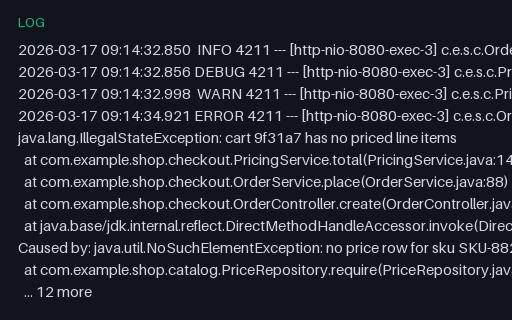
- logPlain-Text Log — Multi-Line Events Needing Line Joining (log)A Spring-style text log where two stack traces span many physical lines. Eight logical events across a larger number of lines, so a shipper's multi-line rule — anything not starting with a timestamp continues the previous event — can be scored against a known answer.
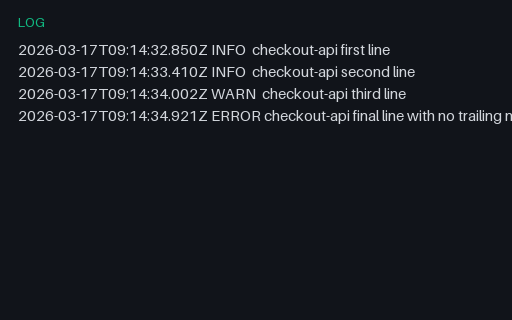
- logPlain-Text Log — No Trailing Newline on the Last Line (log)Four log lines where the last has no terminating newline — the normal state of any file still open for append. A tailer that only emits on seeing a newline holds that fourth line forever, which is why the newest error is the one missing from the dashboard.
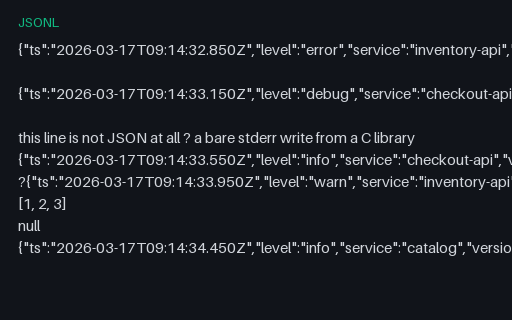
- jsonlStructured Log — Blank, Non-JSON and BOM-Prefixed Lines (jsonl)A JSON Lines file with the debris a real container stream carries: blank and whitespace-only lines, one bare stderr write from a C library, a mid-file byte-order mark and two lines that are valid JSON but not objects. Five real records are in there.
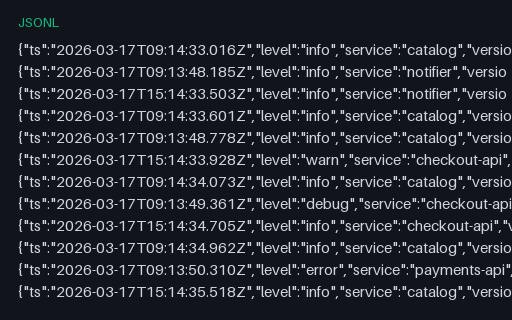
- jsonlStructured Log — Clock Skew Across Three Hosts (jsonl)Three hosts writing to one stream with disagreeing clocks: one 45 seconds behind and one six hours ahead because NTP is unreachable. Interleaved by host, so a naive tail shows events from the future and a retention window silently drops the past.
- jsonlStructured Log — Multi-Line Stack Traces Inside JSON (jsonl)Java, Python and Go stack traces carried inside JSON string fields with their newlines escaped — the shape a structured logger produces, and the one that defeats multi-line joining rules written for plain text. Includes a Caused by chain and a goroutine dump.
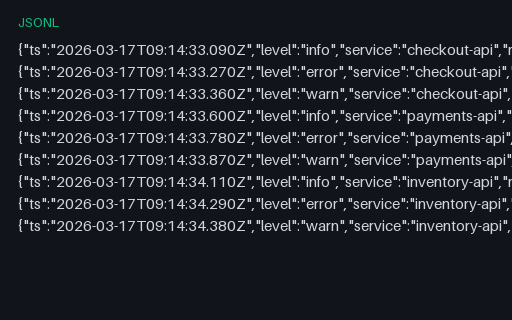
- jsonlStructured Log — Truncated Final Record, Intentionally Corrupt (jsonl)Twelve complete JSON records followed by a thirteenth cut off after 96 bytes with no trailing newline, exactly as a container log looks when the process is killed mid-write. Intentionally corrupt and small: a tailer must hold the partial line for a continuation rather than emit or discard it.
Generated by generation/observability.py. Free for any use, no attribution required — license.