
Syslog RFC 5424 — Structured Data Elements (log)
Five RFC 5424 syslog messages with the version digit, a full RFC 3339 timestamp and two structured-data elements per line — including one carrying the trace ID from this category's trace fixtures. The modern syslog most parsers still handle as if it were RFC 3164.
<134>1 2026-03-17T09:14:32.850Z node-a1 checkout-api 4211 ID47 [origin@32473 ip="192.0.2.11" software="checkout-api" swVersion="1.14.2"][shop@32473 env="staging" trace_id="4bf92f3577b34da6a3ce929d0e0e4736" severity="info"] POST /api/checkout completed status=201 duration=148ms
<132>1 2026-03-17T09:14:33.470Z node-a1 checkout-api 4211 ID48 [origin@32473 ip="192.0.2.11" software="checkout-api" swVersion="1.14.2"][shop@32473 env="staging" trace_id="4bf92f3577b34da6a3ce929d0e0e4736" severity="warn"] downstream call took 71ms, budget is 50ms
<131>1 2026-03-17T09:14:34.090Z node-a1 payments-api 7452 ID49 [origin@32473 ip="192.0.2.11" software="payments-api" swVersion="3.1.4"][shop@32473 env="staging" trace_id="4bf92f3577b34da6a3ce929d0e0e4736" severity="error"] upstream POST /v1/charges timed out after 2.0s
<134>1 2026-03-17T09:14:34.710Z node-a1 cart-api 1180 ID50 [origin@32473 ip="192.0.2.11" software="cart-api" swVersion="0.9.7"][shop@32473 env="staging" trace_id="4bf92f3577b34da6a3ce929d0e0e4736" severity="info"] cache warmed keys=1284
<129>1 2026-03-17T09:14:35.330Z node-a1 inventory-api 990 ID51 [origin@32473 ip="192.0.2.11" software="inventory-api" swVersion="2.3.0"][shop@32473 env="staging" trace_id="4bf92f3577b34da6a3ce929d0e0e4736" severity="alert"] stock reservation queue depth exceeded 10000
Specifications
- Lines
- 5
- Version
- 1
- Structured Data Elements
- 2
- Priorities Used
- 129, 131, 132, 134
- Has Trace Id In Sd
- true
- Facility
- 16
- Note
- RFC 3164 BSD syslog ships separately under data/logs
Testing contract
Expected to pass- Scenario
- Parse each line and decode the PRI value and structured data.
- Expected result
- PRI 131 decodes to facility 16 severity 3 (error), both SD-IDs are extracted per line as separate elements, and the trace_id parameter is available for correlation.
What is a .log file?
LOG files are plain-text records of events emitted by software, typically one entry per line with a timestamp, severity, and message. There is no single standard, so formats range from unstructured text to structured JSON lines. They are central to debugging, monitoring, and auditing.
How to use this file
Use an example LOG file to test log parsers, timestamp and severity extraction, line-oriented streaming, and ingestion into monitoring or analysis pipelines.
How to use this file for testing
“Syslog RFC 5424 — Structured Data Elements (log)” is a deterministic Novus Examples fixture for Observability, Log parsing, Config parsing. Structured and plain-text telemetry with known timestamps, levels, request identifiers, and error states for testing log ingestion, correlation, dashboards, and alert pipelines.
Documented properties for this file: LOG · 1,319 bytes. Compare results against paired or grouped companions on this page when present (clean↔damaged, searchable↔scanned, or format twins) so scores stay reproducible across runs.
Download the file once, keep the path stable in CI or local scripts, and treat the spec table as the contract: dimensions, seeds, field lists, and roles are intentional. Corrupt or invalid samples are labelled as such — expect parsers to fail loudly rather than silently accept them.
Telemetry fixtures use fixed trace IDs, span IDs, and timestamps so ingestion is reproducible run to run. Point your collector, parser, or query layer at the file and assert the documented span tree, metric families, or severity mix; service and host names are invented.
Code examples
grep -i error syslog-rfc5424.log | head
awk '{print $1, $2, $NF}' syslog-rfc5424.log | head
Related files
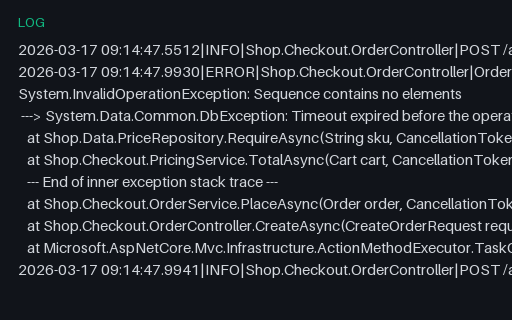
- log.NET Exception with an Inner Exception Chain (log)A .NET exception whose inner exception is introduced by the ---> marker and closed by End of inner exception stack trace, wrapped in pipe-delimited log lines. Error groupers that key on the outermost message alone merge two genuinely different faults here.
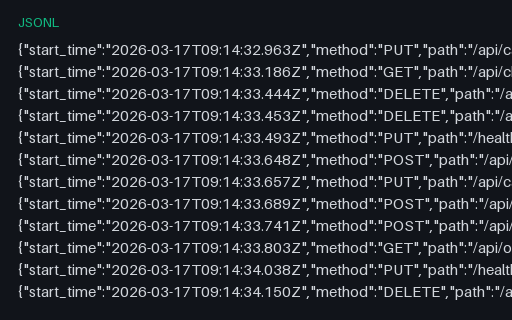
- jsonlEnvoy-Style Proxy Access Log — JSON Lines (jsonl)Forty service-mesh proxy access records with the fields that make mesh debugging possible: response_flags distinguishing an upstream failure from an overflow, upstream_service_time against total duration, upstream host and cluster, and a request ID for correlation.
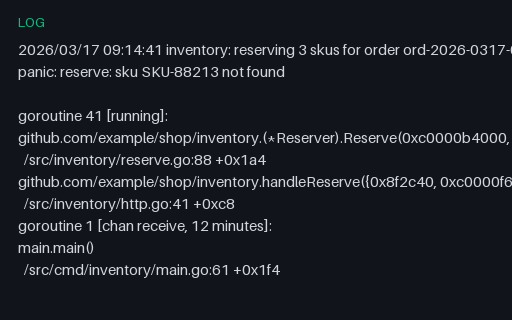
- logGo Panic with Full Goroutine Dump (log)A Go panic followed by the runtime's full goroutine dump — four goroutines with their wait states, two-line frames and a created by attribution, separated by blank lines. Blank-line separation defeats multi-line rules that treat an empty line as the end of an event.
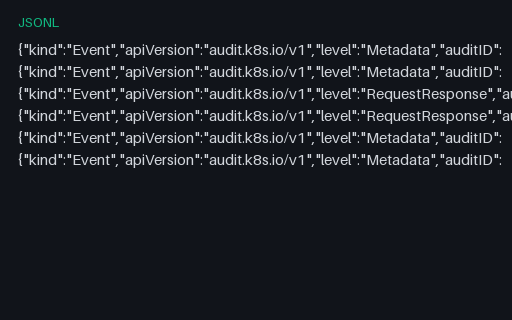
- jsonlKubernetes Audit Log — Six Events with an RBAC Denial (jsonl)Six Kubernetes audit events at two audit levels, including one 403 whose authorization annotations record the forbid decision and its reason. The shape a cluster-audit alert or compliance report reads, with every user and service account invented.
- jsonOTLP Logs — Export Document with Severity and Trace Correlation (json)An OTLP logs export across two resources: five records spanning DEBUG to FATAL with both severityNumber and severityText, separate event and observed timestamps, trace and span correlation, and one record whose body is a full multi-line Python traceback.
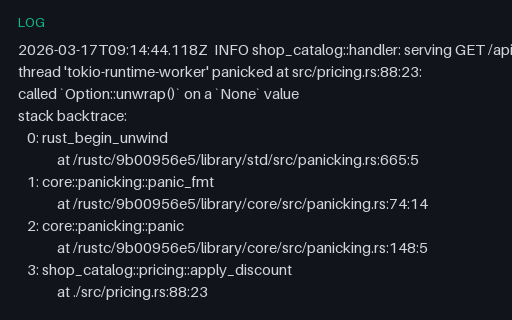
- logRust Panic with Numbered Backtrace (log)A Rust panic surrounded by ordinary tracing output: the panic location with line and column, a six-frame numbered backtrace where every frame spans two lines, and the RUST_BACKTRACE note. Frame numbering and the deep indent are what a generic stack parser gets wrong here.
Generated by generation/observability.py. Free for any use, no attribution required — license.