
Prometheus HTTP API — Error Envelope with a PromQL Parse Error (json)
The error envelope a Prometheus API returns for a malformed PromQL query — status, errorType, a message with a line and column position, and an empty but present data object. Clients that only check for a data key render this as a successful empty result.
{
  "status": "error",
  "errorType": "bad_data",
  "error": "invalid parameter \"query\": 1:26: parse error: unexpected identifier \"by\" in aggregation expression, expected \"(\"",
  "data": {
    "resultType": "vector",
    "result": []
  }
}
Specifications
- Status
- error
- Error Type
- bad_data
- Http Status
- 400
- Carries Empty Data
- true
- Has Line Column Position
- true
Testing contract
Expected to pass- Scenario
- Send a malformed query and handle the response in your API client.
- Expected result
- The client reports the parse error with its 1:26 position instead of rendering an empty chart, because it checks status before reading data.
What is a .json file?
JSON (JavaScript Object Notation) is a lightweight, text-based data-interchange format representing objects, arrays, strings, numbers, booleans, and null. It is language-independent, human-readable, and the dominant format for web APIs and configuration. It requires a single well-formed root value.
How to use this file
Use an example JSON file to test parsers and serializers, schema validation, Unicode and number-precision handling, and API request or response processing.
How to use this file for testing
“Prometheus HTTP API — Error Envelope with a PromQL Parse Error (json)” is a deterministic Novus Examples fixture for Observability, Error handling, API testing. Structured and plain-text telemetry with known timestamps, levels, request identifiers, and error states for testing log ingestion, correlation, dashboards, and alert pipelines.
Documented properties for this file: JSON · 246 bytes. Compare results against paired or grouped companions on this page when present (clean↔damaged, searchable↔scanned, or format twins) so scores stay reproducible across runs.
Download the file once, keep the path stable in CI or local scripts, and treat the spec table as the contract: dimensions, seeds, field lists, and roles are intentional. Corrupt or invalid samples are labelled as such — expect parsers to fail loudly rather than silently accept them.
Telemetry fixtures use fixed trace IDs, span IDs, and timestamps so ingestion is reproducible run to run. Point your collector, parser, or query layer at the file and assert the documented span tree, metric families, or severity mix; service and host names are invented.
Code examples
import json

with open("prometheus-api-error.json") as f:
    data = json.load(f)
print(type(data), len(data))
Related files
- promOpenMetrics — Missing # EOF Marker, Intentionally Invalid (prom)A document that parses perfectly as Prometheus text and is invalid as OpenMetrics, because the mandatory # EOF terminator is missing. That marker is the format's only defence against a truncated response being accepted as complete — which is the exact failure this file reproduces.
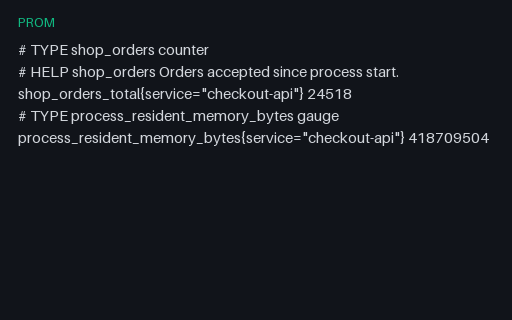
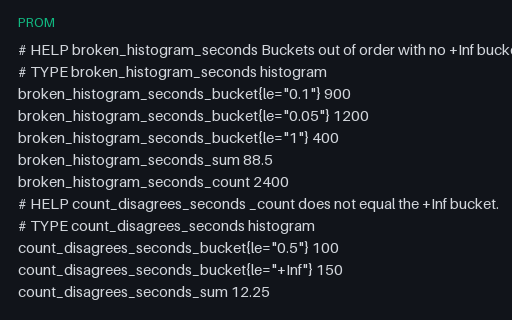
- promPrometheus Exposition — Broken Histograms, Intentionally Invalid (prom)Two histogram families that are syntactically fine and semantically wrong: one has non-monotonic buckets and no +Inf bucket, the other reports a _count larger than its +Inf bucket. Intentionally invalid, because histogram_quantile over either produces a confidently wrong number rather than an error.
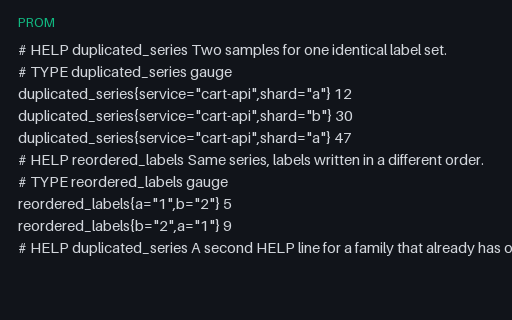
- promPrometheus Exposition — Duplicate Series, Intentionally Invalid (prom)One label set exposed twice, a second pair that is only a duplicate once labels are sorted, and a repeated HELP line. Intentionally invalid: a scrape must fail rather than let last-write-wins decide which of two values for the same series survives.
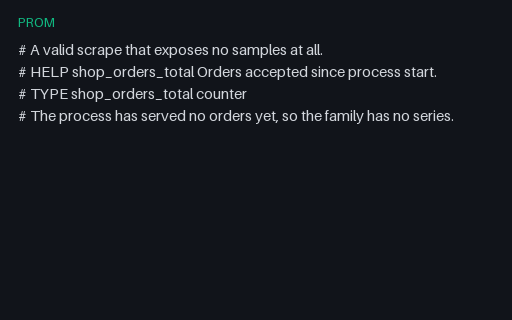
- promPrometheus Exposition — Empty but Valid Scrape (prom)A scrape body with metadata but no samples, which is what a freshly started process returns before it has recorded anything. Valid, and routinely mistaken for a failed scrape by code that treats an empty result as an error.
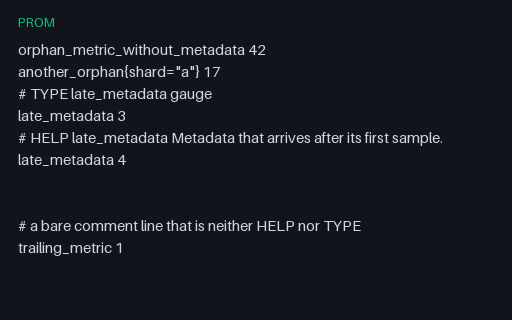
- promPrometheus Exposition — Samples with No HELP or TYPE (prom)Samples exposed with no HELP or TYPE at all, metadata arriving after the sample it describes, blank and whitespace-only lines and a bare comment. All of it is legal — metadata is optional — and all of it breaks parsers that assume every sample is introduced by a TYPE line.
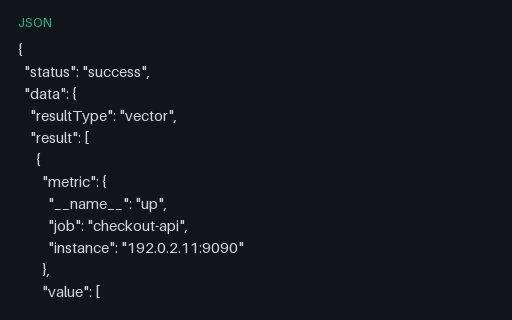
- jsonPrometheus HTTP API — Instant Query Vector with Warnings (json)An instant-query response: five up series at a single evaluation timestamp, one of them zero, plus a warnings array that clients routinely ignore. A successful response can carry warnings, and dropping them hides truncated results.
Generated by generation/observability.py. Free for any use, no attribution required — license.