
Prometheus Exposition — Samples with No HELP or TYPE (prom)
Samples exposed with no HELP or TYPE at all, metadata arriving after the sample it describes, blank and whitespace-only lines and a bare comment. All of it is legal — metadata is optional — and all of it breaks parsers that assume every sample is introduced by a TYPE line.
orphan_metric_without_metadata 42
another_orphan{shard="a"} 17
# TYPE late_metadata gauge
late_metadata 3
# HELP late_metadata Metadata that arrives after its first sample.
late_metadata 4


# a bare comment line that is neither HELP nor TYPE
trailing_metric 1
Specifications
- Samples
- 5
- Distinct Series
- 4
- Families Without Metadata
- 3
- Blank Lines
- 2
- Bare Comment Lines
- 1
- Metadata After Sample
- true
Testing contract
Expected to recover- Scenario
- Parse the file and record each family's inferred type.
- Expected result
- All five samples parse, families with no TYPE default to untyped rather than being dropped, and the blank and comment lines are skipped without ending the scrape.
What is a .prom file?
A .prom file holds metrics in the Prometheus text exposition format, the same body a `/metrics` endpoint returns. Each metric family is introduced by `# HELP` and `# TYPE` comments and followed by one sample per line: a metric name, an optional brace-delimited label set, a value, and an optional millisecond timestamp. Counters, gauges, histograms (with `_bucket`, `_sum`, `_count` series and a `+Inf` bucket), and summaries with quantile labels all use this one grammar.
How to use this file
Use an example .prom file to test exposition-format parsers, scrapers, and the node_exporter textfile collector — checking label escaping, histogram bucket ordering and cumulative counts, and the handling of `NaN` and `+Inf` values.
How to use this file for testing
“Prometheus Exposition — Samples with No HELP or TYPE (prom)” is a deterministic Novus Examples fixture for Observability, Config parsing, Error handling. Structured and plain-text telemetry with known timestamps, levels, request identifiers, and error states for testing log ingestion, correlation, dashboards, and alert pipelines.
Documented properties for this file: PROM · 264 bytes. Compare results against paired or grouped companions on this page when present (clean↔damaged, searchable↔scanned, or format twins) so scores stay reproducible across runs.
Download the file once, keep the path stable in CI or local scripts, and treat the spec table as the contract: dimensions, seeds, field lists, and roles are intentional. Corrupt or invalid samples are labelled as such — expect parsers to fail loudly rather than silently accept them.
Telemetry fixtures use fixed trace IDs, span IDs, and timestamps so ingestion is reproducible run to run. Point your collector, parser, or query layer at the file and assert the documented span tree, metric families, or severity mix; service and host names are invented.
Related files
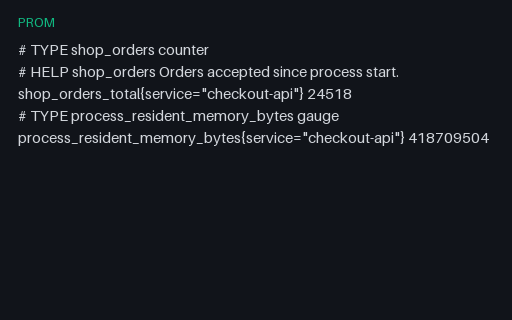
- promOpenMetrics — Missing # EOF Marker, Intentionally Invalid (prom)A document that parses perfectly as Prometheus text and is invalid as OpenMetrics, because the mandatory # EOF terminator is missing. That marker is the format's only defence against a truncated response being accepted as complete — which is the exact failure this file reproduces.
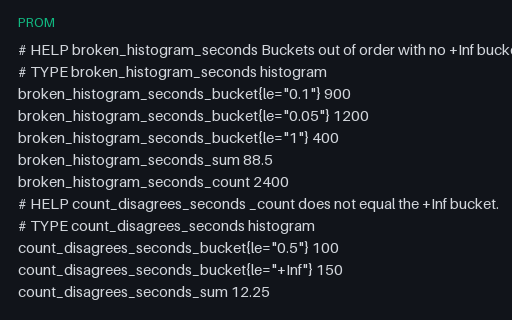
- promPrometheus Exposition — Broken Histograms, Intentionally Invalid (prom)Two histogram families that are syntactically fine and semantically wrong: one has non-monotonic buckets and no +Inf bucket, the other reports a _count larger than its +Inf bucket. Intentionally invalid, because histogram_quantile over either produces a confidently wrong number rather than an error.
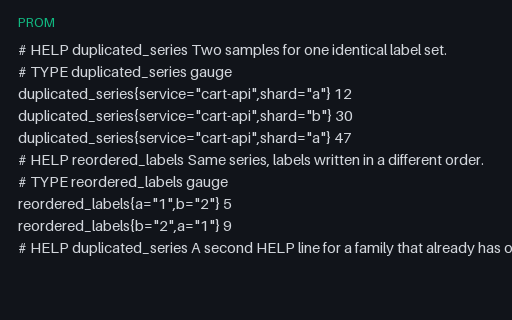
- promPrometheus Exposition — Duplicate Series, Intentionally Invalid (prom)One label set exposed twice, a second pair that is only a duplicate once labels are sorted, and a repeated HELP line. Intentionally invalid: a scrape must fail rather than let last-write-wins decide which of two values for the same series survives.
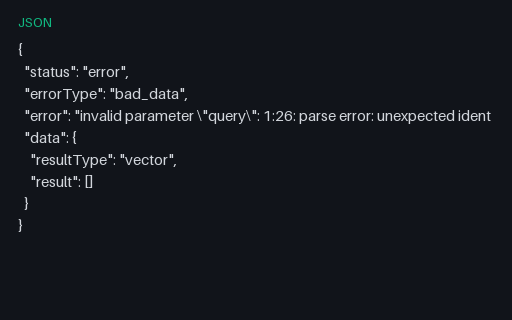
- jsonPrometheus HTTP API — Error Envelope with a PromQL Parse Error (json)The error envelope a Prometheus API returns for a malformed PromQL query — status, errorType, a message with a line and column position, and an empty but present data object. Clients that only check for a data key render this as a successful empty result.
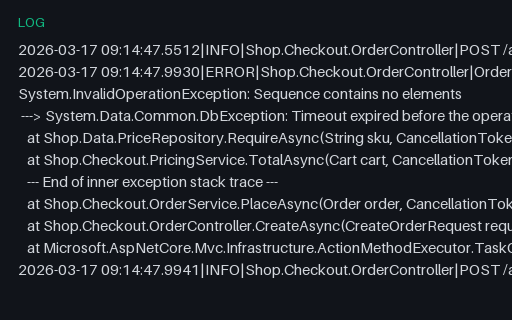
- log.NET Exception with an Inner Exception Chain (log)A .NET exception whose inner exception is introduced by the ---> marker and closed by End of inner exception stack trace, wrapped in pipe-delimited log lines. Error groupers that key on the outermost message alone merge two genuinely different faults here.
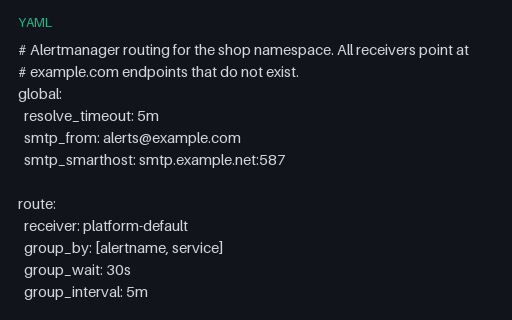
- yamlAlertmanager Config — Routing Tree, Inhibition and Mute Windows (yaml)An Alertmanager configuration with the routing behaviour that is hard to reason about without a fixture: a continue: true branch so a critical alert reaches two receivers, an inhibition rule suppressing warnings under a matching critical, and a weekend mute window.
Generated by generation/observability.py. Free for any use, no attribution required — license.