
Prometheus Exposition — Duplicate Series, Intentionally Invalid (prom)
One label set exposed twice, a second pair that is only a duplicate once labels are sorted, and a repeated HELP line. Intentionally invalid: a scrape must fail rather than let last-write-wins decide which of two values for the same series survives.
# HELP duplicated_series Two samples for one identical label set.
# TYPE duplicated_series gauge
duplicated_series{service="cart-api",shard="a"} 12
duplicated_series{service="cart-api",shard="b"} 30
duplicated_series{service="cart-api",shard="a"} 47
# HELP reordered_labels Same series, labels written in a different order.
# TYPE reordered_labels gauge
reordered_labels{a="1",b="2"} 5
reordered_labels{b="2",a="1"} 9
# HELP duplicated_series A second HELP line for a family that already has one.
Specifications
- Duplicate Pairs
- 2
- Reordered Label Duplicate
- true
- Duplicate Help Line
- true
- Intentionally Invalid
- true
- Rule
- a label set may appear at most once per scrape
Testing contract
Expected to fail- Scenario
- Scrape the file with a conformant Prometheus parser.
- Expected result
- The scrape is rejected with a duplicate-series error that names duplicated_series{service="cart-api",shard="a"}, and the reordered-label pair is detected as the same series as well.
What is a .prom file?
A .prom file holds metrics in the Prometheus text exposition format, the same body a `/metrics` endpoint returns. Each metric family is introduced by `# HELP` and `# TYPE` comments and followed by one sample per line: a metric name, an optional brace-delimited label set, a value, and an optional millisecond timestamp. Counters, gauges, histograms (with `_bucket`, `_sum`, `_count` series and a `+Inf` bucket), and summaries with quantile labels all use this one grammar.
How to use this file
Use an example .prom file to test exposition-format parsers, scrapers, and the node_exporter textfile collector — checking label escaping, histogram bucket ordering and cumulative counts, and the handling of `NaN` and `+Inf` values.
How to use this file for testing
“Prometheus Exposition — Duplicate Series, Intentionally Invalid (prom)” is a deterministic Novus Examples fixture for Observability, Schema validation, Error handling. Structured and plain-text telemetry with known timestamps, levels, request identifiers, and error states for testing log ingestion, correlation, dashboards, and alert pipelines.
Documented properties for this file: PROM · 497 bytes. Compare results against paired or grouped companions on this page when present (clean↔damaged, searchable↔scanned, or format twins) so scores stay reproducible across runs.
Download the file once, keep the path stable in CI or local scripts, and treat the spec table as the contract: dimensions, seeds, field lists, and roles are intentional. Corrupt or invalid samples are labelled as such — expect parsers to fail loudly rather than silently accept them.
Telemetry fixtures use fixed trace IDs, span IDs, and timestamps so ingestion is reproducible run to run. Point your collector, parser, or query layer at the file and assert the documented span tree, metric families, or severity mix; service and host names are invented.
Related files
- promOpenMetrics — Missing # EOF Marker, Intentionally Invalid (prom)A document that parses perfectly as Prometheus text and is invalid as OpenMetrics, because the mandatory # EOF terminator is missing. That marker is the format's only defence against a truncated response being accepted as complete — which is the exact failure this file reproduces.
- jsonOTLP Trace — All-Zero Trace and Span IDs, Intentionally Invalid (json)A trace whose trace ID and root span ID are all zeroes — the value an uninitialised context produces. Intentionally invalid: the specification defines all-zero IDs as invalid, so a conformant receiver must reject the spans instead of creating a permanent bucket that every broken service writes into.
- jsonOTLP Trace — Duplicate Span IDs, Intentionally Invalid (json)Two different spans share one span ID inside a single trace, which the specification forbids. Intentionally invalid: it is the fixture for the de-duplication path, where a naive store silently overwrites one span with the other and loses a subtree.
- jsonOTLP Trace — Negative and Zero Durations, Intentionally Invalid (json)One span ends 8.4 ms before it started and another has identical start and end timestamps. Intentionally invalid: negative durations poison latency aggregates — a single one can drag a p99 below zero — so this is the fixture for the validation that must sit in front of any duration metric.
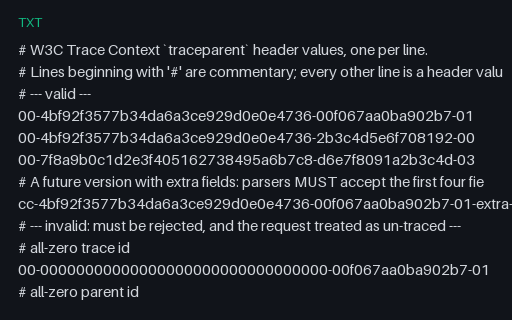
- txtW3C traceparent — Valid and Invalid Header Cases (txt)A labelled set of traceparent header values: four that must parse — including a future version with extra fields, which parsers are required to accept — and eight that must be rejected, covering all-zero IDs, version ff, short and uppercase trace IDs, and missing or trailing fields.
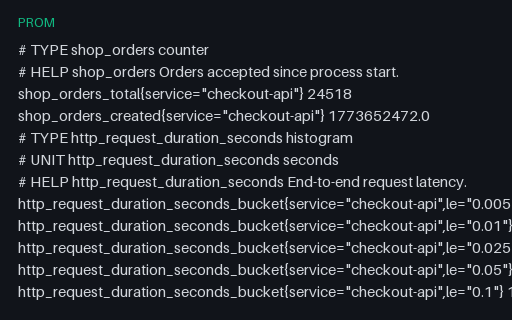
- promOpenMetrics — Full Document with UNIT, info and stateset (prom)A complete OpenMetrics document — the _total and _created series a counter really has, UNIT metadata, an info metric carrying build metadata and a stateset with exactly one active state — terminated by the mandatory # EOF. This is what the exposition format became once it was standardised.
Generated by generation/observability.py. Free for any use, no attribution required — license.