
Prometheus Exposition — Label Value Escaping Edge Cases (prom)
Ten series whose label values contain the characters that break naive line splitting — escaped quotes and backslashes, an escaped newline, non-ASCII text, braces, commas, equals signs, a leading hash and significant whitespace. The exposition format defines exactly three escapes and this file uses all of them.
# HELP tricky_label_values Label values exercising every escape the format allows.
# TYPE tricky_label_values gauge
tricky_label_values{quote="he said \"deploy it\""} 1
tricky_label_values{backslash="C:\\logs\\app"} 2
tricky_label_values{newline="line one\nline two"} 3
tricky_label_values{unicode="café — ünïcödé ✅"} 4
tricky_label_values{empty=""} 5
tricky_label_values{braces="{not a label set}"} 6
tricky_label_values{comma="a,b,c",equals="k=v"} 7
tricky_label_values{hash="# not a comment"} 8
tricky_label_values{spaces="  padded  "} 9
# HELP help_with_escapes Help text may escape backslash \\ and newline \n only.
# TYPE help_with_escapes gauge
help_with_escapes 1
Specifications
- Series
- 10
- Escape Sequences
- 3
- Includes Unicode
- true
- Includes Embedded Comma
- true
- Includes Hash In Value
- true
- Rule
- only \\, \" and \n are escapes
Testing contract
Expected to pass- Scenario
- Parse the file with a regex-free exposition parser and read back each label value.
- Expected result
- The comma and equals values stay inside their single label rather than splitting into more, the hash value is not treated as a comment, and \n unescapes to one real newline.
What is a .prom file?
A .prom file holds metrics in the Prometheus text exposition format, the same body a `/metrics` endpoint returns. Each metric family is introduced by `# HELP` and `# TYPE` comments and followed by one sample per line: a metric name, an optional brace-delimited label set, a value, and an optional millisecond timestamp. Counters, gauges, histograms (with `_bucket`, `_sum`, `_count` series and a `+Inf` bucket), and summaries with quantile labels all use this one grammar.
How to use this file
Use an example .prom file to test exposition-format parsers, scrapers, and the node_exporter textfile collector — checking label escaping, histogram bucket ordering and cumulative counts, and the handling of `NaN` and `+Inf` values.
How to use this file for testing
“Prometheus Exposition — Label Value Escaping Edge Cases (prom)” is a deterministic Novus Examples fixture for Observability, Encoding detection, Config parsing. Structured and plain-text telemetry with known timestamps, levels, request identifiers, and error states for testing log ingestion, correlation, dashboards, and alert pipelines.
Documented properties for this file: PROM · 681 bytes. Compare results against paired or grouped companions on this page when present (clean↔damaged, searchable↔scanned, or format twins) so scores stay reproducible across runs.
Download the file once, keep the path stable in CI or local scripts, and treat the spec table as the contract: dimensions, seeds, field lists, and roles are intentional. Corrupt or invalid samples are labelled as such — expect parsers to fail loudly rather than silently accept them.
Telemetry fixtures use fixed trace IDs, span IDs, and timestamps so ingestion is reproducible run to run. Point your collector, parser, or query layer at the file and assert the documented span tree, metric families, or severity mix; service and host names are invented.
Related files
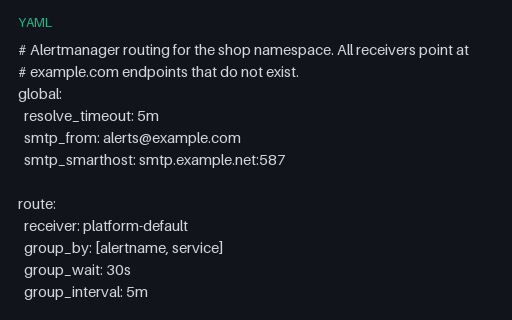
- yamlAlertmanager Config — Routing Tree, Inhibition and Mute Windows (yaml)An Alertmanager configuration with the routing behaviour that is hard to reason about without a fixture: a continue: true branch so a critical alert reaches two receivers, an inhibition rule suppressing warnings under a matching critical, and a weekend mute window.
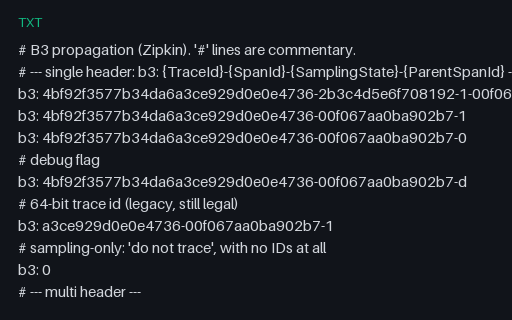
- txtB3 Propagation — Single and Multi-Header Forms (txt)B3 context propagation in both shapes — the compact single b3 header including the debug flag, a legacy 64-bit trace ID and the sampling-only form, plus the five X-B3-* multi-header fields — with two malformed values that must be rejected.
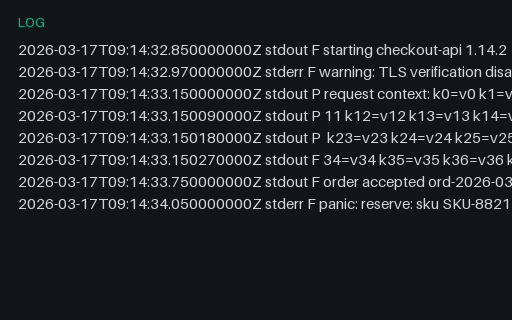
- logCRI Container Log — Partial Lines and Two Streams (log)The CRI log format Kubernetes nodes actually write: an RFC 3339 nanosecond timestamp, a stream name, and an F or P tag marking whether the line is full or a partial continuation. One long message is split across several P lines that must be rejoined before parsing.
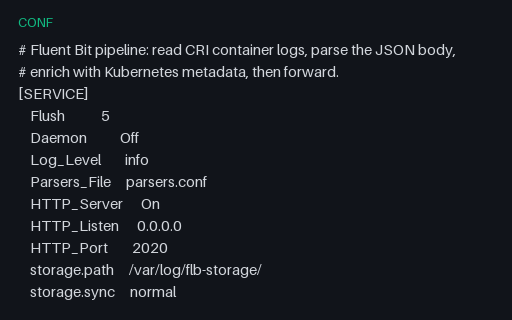
- confFluent Bit — Tail, Enrich and Forward Pipeline (conf)A Fluent Bit configuration in its INI-like section format: a tail input using the CRI multiline parser that reassembles the partial-line fixture, Kubernetes enrichment, a modify filter dropping two of the high-cardinality fields, and a throttle. Keys are space-aligned, not delimited.
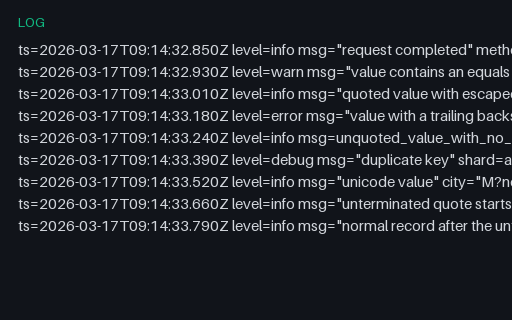
- loglogfmt — Quoting, Escaping and Bare-Key Edge Cases (log)logfmt lines built to break naive splitting on spaces and equals signs: a value containing an equals sign, escaped quotes, a trailing backslash before the closing quote, a bare key with no value, duplicate keys, non-ASCII values and one unterminated quote followed by a clean line.
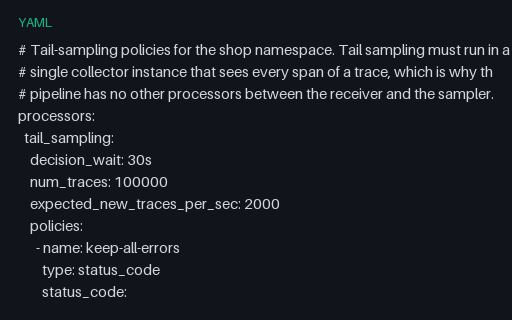
- yamlOpenTelemetry Collector — Tail-Sampling Policies (yaml)Six tail-sampling policies including an inverted regex match that drops health checks and a composite policy with its own rate limit and ordered sub-policies. Policies are OR-ed and one match keeps the entire trace, which is the semantic most people get backwards.
Generated by generation/observability.py. Free for any use, no attribution required — license.