
Speedscope — Evented Profile with Open and Close Events (json)
The evented half of the speedscope format — explicit O and C events that must nest like brackets, rather than sampled stacks. Tracing profilers emit this shape, and an unbalanced or out-of-order close is the corruption a loader has to detect.
{
  "$schema": "https://www.speedscope.app/file-format-schema.json",
  "name": "checkout-api evented profile",
  "exporter": "novus-examples observability fixture",
  "activeProfileIndex": 0,
  "shared": {
    "frames": [
      {
        "name": "(root)"
      },
      {
        "name": "main"
      },
      {
        "name": "http.(*conn).serve"
      },
      {
        "name": "checkout.Handle"
      },
      {
        "name": "checkout.price"
      },
      {
        "name": "pricing.applyDiscount"
      },
      {
        "name": "encoding/json.Marshal"
      },
      {
        "name": "sql.(*DB).QueryContext"
      },
      {
        "name": "runtime.gcBgMarkWorker"
      }
    ]
  },
  "profiles": [
    {
      "type": "evented",
      "name": "cpu",
      "unit": "nanoseconds",
      "startValue": 0,
      "endValue": 8000000000,
      "events": [
        {
          "type": "O",
          "frame": 1,
          "at": 0
        },
{Specifications
- Profile Type
- evented
- Events
- 10
- Open Events
- 5
- Close Events
- 5
- Properly Nested
- true
- Unit
- nanoseconds
- End Value
- 8000000000
Testing contract
Expected to pass- Scenario
- Replay the event stream and maintain a call stack.
- Expected result
- The ten events open and close in strict LIFO order leaving an empty stack at endValue, and every close event matches the frame at the top of the stack.
What is a .json file?
JSON (JavaScript Object Notation) is a lightweight, text-based data-interchange format representing objects, arrays, strings, numbers, booleans, and null. It is language-independent, human-readable, and the dominant format for web APIs and configuration. It requires a single well-formed root value.
How to use this file
Use an example JSON file to test parsers and serializers, schema validation, Unicode and number-precision handling, and API request or response processing.
How to use this file for testing
“Speedscope — Evented Profile with Open and Close Events (json)” is a deterministic Novus Examples fixture for Observability, JSON parsing, Performance testing. Structured and plain-text telemetry with known timestamps, levels, request identifiers, and error states for testing log ingestion, correlation, dashboards, and alert pipelines.
Documented properties for this file: JSON · 1,803 bytes. Compare results against paired or grouped companions on this page when present (clean↔damaged, searchable↔scanned, or format twins) so scores stay reproducible across runs.
Download the file once, keep the path stable in CI or local scripts, and treat the spec table as the contract: dimensions, seeds, field lists, and roles are intentional. Corrupt or invalid samples are labelled as such — expect parsers to fail loudly rather than silently accept them.
Telemetry fixtures use fixed trace IDs, span IDs, and timestamps so ingestion is reproducible run to run. Point your collector, parser, or query layer at the file and assert the documented span tree, metric families, or severity mix; service and host names are invented.
Code examples
import json

with open("speedscope-evented-profile.json") as f:
    data = json.load(f)
print(type(data), len(data))
Related files
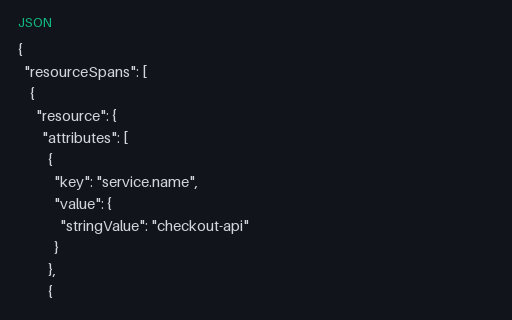
- jsonOTLP Trace — 48-Span Linear Chain (json)A single-service trace 48 levels deep — a recursive GraphQL-style resolver where every span is the child of the one before it. A depth fixture for waterfall renderers, tree-layout code and any parser that recurses over parentage.
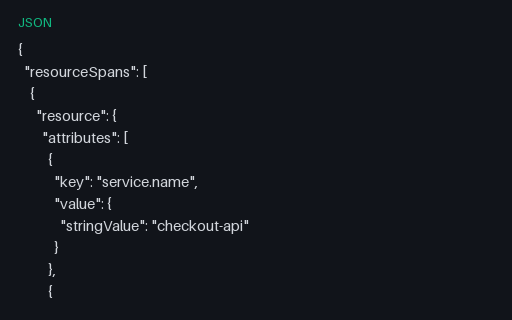
- jsonOTLP Trace — 60-Way Parallel Fan-Out (json)One root span with 60 overlapping children — a scatter-gather query across database shards. The counterpart to the deep-chain fixture: shallow but very wide, which is what breaks waterfall layouts that assume spans do not overlap in time.
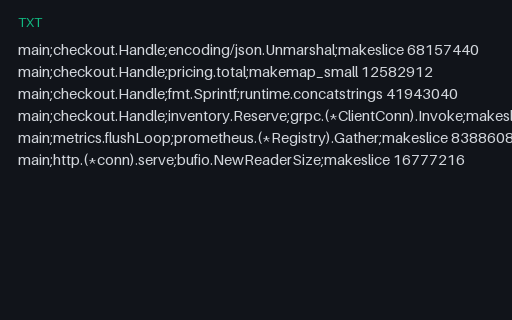
- txtAllocation Profile — Folded Stacks Weighted in Bytes (txt)An allocation profile in the same folded syntax as the CPU profiles, but weighted in bytes rather than samples. The format carries no unit, so a viewer that assumes samples renders 65 MB of allocation as 68 million samples — which is what this fixture is for.
- txtCPU Profile — Folded Stacks After a Regression (txt)The same workload after a change: JSON decoding costs four times as much and gains a new reflect frame, while cache lookups get cheaper. Paired with the baseline so a differential flamegraph can be scored against a known regression and a known improvement.
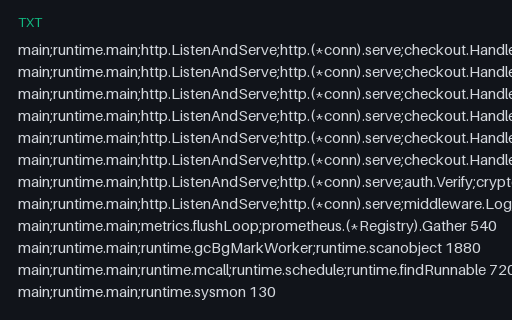
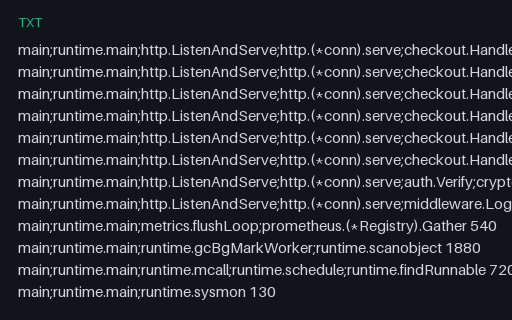
- txtCPU Profile — Folded Stacks, Baseline (txt)A CPU profile in the folded-stack format every flamegraph tool reads: one line per unique stack, frames separated by semicolons, then a space and a sample count. Twelve stacks up to seven frames deep, with the runtime's GC and scheduler work included as real profiles have.
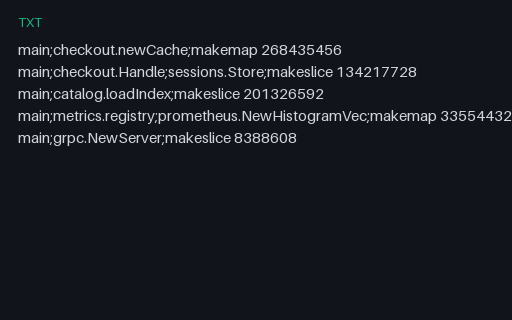
- txtHeap Profile — In-Use Bytes by Allocation Site (txt)A heap profile measuring bytes still live at the sample point, not bytes ever allocated — which is why its shape differs from the allocation profile of the same process. 620 MB retained across five sites, with an unbounded session cache at the top.
Generated by generation/observability.py. Free for any use, no attribution required — license.