
OTLP Trace — 60-Way Parallel Fan-Out (json)
One root span with 60 overlapping children — a scatter-gather query across database shards. The counterpart to the deep-chain fixture: shallow but very wide, which is what breaks waterfall layouts that assume spans do not overlap in time.
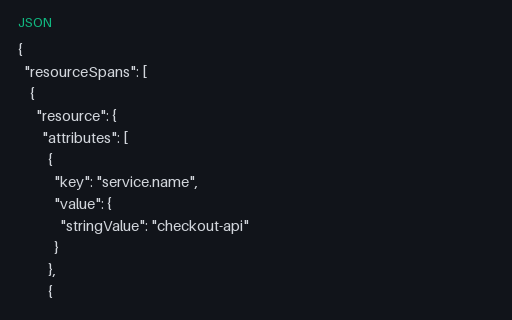
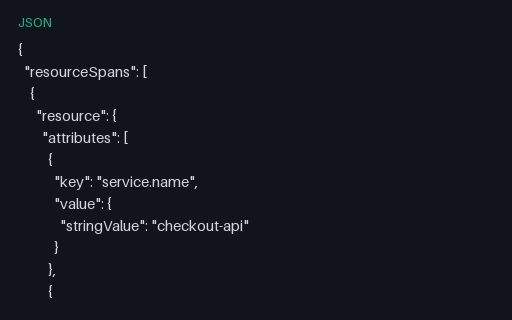
{
  "resourceSpans": [
    {
      "resource": {
        "attributes": [
          {
            "key": "service.name",
            "value": {
              "stringValue": "checkout-api"
            }
          },
          {
            "key": "service.namespace",
            "value": {
              "stringValue": "shop"
            }
          },
          {
            "key": "service.version",
            "value": {
              "stringValue": "1.14.2"
            }
          },
          {
            "key": "service.instance.id",
            "value": {
              "stringValue": "checkout-api-7d9f4c-2xk"
            }
          },
          {
            "key": "deployment.environment.name",
            "value": {
              "stringValue": "staging"
            }
          },
          {
            "key": "host.name",
            "value": {
              "stringValue": "node-a1"
            }
          },
          {
            "key": "host.ip",
            "value": {
              "stringValue": "192.0.2.11"
            }
          },
          {
            "key": "cloud.region",
"value": {Specifications
- Spans
- 61
- Depth
- 2
- Children
- 60
- Shape
- fan-out
- Overlapping
- true
- Root Duration Ms
- 74
Testing contract
Expected to pass- Scenario
- Lay out the trace as a waterfall and compute critical path.
- Expected result
- 60 sibling spans overlap in time under a 74 ms root, and the critical path is the longest child rather than the sum of all children.
What is a .json file?
JSON (JavaScript Object Notation) is a lightweight, text-based data-interchange format representing objects, arrays, strings, numbers, booleans, and null. It is language-independent, human-readable, and the dominant format for web APIs and configuration. It requires a single well-formed root value.
How to use this file
Use an example JSON file to test parsers and serializers, schema validation, Unicode and number-precision handling, and API request or response processing.
How to use this file for testing
“OTLP Trace — 60-Way Parallel Fan-Out (json)” is a deterministic Novus Examples fixture for Observability, JSON parsing, Performance testing. Structured and plain-text telemetry with known timestamps, levels, request identifiers, and error states for testing log ingestion, correlation, dashboards, and alert pipelines.
Documented properties for this file: JSON · 52,360 bytes. Compare results against paired or grouped companions on this page when present (clean↔damaged, searchable↔scanned, or format twins) so scores stay reproducible across runs.
Download the file once, keep the path stable in CI or local scripts, and treat the spec table as the contract: dimensions, seeds, field lists, and roles are intentional. Corrupt or invalid samples are labelled as such — expect parsers to fail loudly rather than silently accept them.
Telemetry fixtures use fixed trace IDs, span IDs, and timestamps so ingestion is reproducible run to run. Point your collector, parser, or query layer at the file and assert the documented span tree, metric families, or severity mix; service and host names are invented.
Code examples
import json

with open("otlp-trace-wide-fanout.json") as f:
    data = json.load(f)
print(type(data), len(data))
Related files
- jsonChrome DevTools CPU Profile — Node Tree with Sample Deltas (json)The .cpuprofile shape V8 emits: a node tree with call frames, a samples array of node IDs and a parallel timeDeltas array, plus the synthesized (idle), (program) and (garbage collector) nodes. Counting those synthetic frames as application time is the classic misreading.
- jsonSpeedscope — Evented Profile with Open and Close Events (json)The evented half of the speedscope format — explicit O and C events that must nest like brackets, rather than sampled stacks. Tracing profilers emit this shape, and an unbalanced or out-of-order close is the corruption a loader has to detect.
- jsonSpeedscope — Sampled Profile with a Shared Frame Table (json)A speedscope sampled profile: one shared frame table with source locations, then stacks expressed as arrays of frame indices with per-sample weights in nanoseconds. The index indirection is the whole design, and resolving it wrong produces a plausible but wrong flamegraph.
- jsonJaeger JSON Trace — Same 13-Span Checkout (json)The checkout trace in the Jaeger query-API shape — a data array holding one trace, spans carrying microsecond startTime and duration, CHILD_OF references, typed tags and a per-service processes map. The same span tree as the OTLP and Zipkin twins, so a converter can be scored exactly.
- jsonOTLP Trace — AnyValue Attribute Type Matrix (json)One span carrying every OTLP AnyValue kind — string (plain, Unicode, multi-line, empty), int64 encoded as a JSON string, double, bool, array, nested kvlist and base64 bytes. Includes an integer above 2^53 to catch decoders that route int64 through a JavaScript number.
- jsonOTLP Trace — Clock Skew, Child Starts Before Its Parent (json)Two hosts whose clocks disagree by 12 ms, so a server span appears to start before the client span that called it. Nothing in the payload is malformed — this is the most common real cause of a negative-latency gap in a waterfall, and viewers must show it rather than crash or silently reorder.
Generated by generation/observability.py. Free for any use, no attribution required — license.