
Prometheus Alerting Rules — Intentionally Invalid, Five Distinct Faults (yaml)
A rule file that is perfectly valid YAML and completely invalid as Prometheus rules: a rule that is both an alert and a recording rule, a PromQL syntax error, a duplicated group name, a rule with no expr and a duration written in prose. Intentionally invalid, with each fault labelled in place.
# INTENTIONALLY INVALID rule file. Every group below breaks a different
# promtool check, and the comments say which.
groups:
  # 1. `alert` and `record` are mutually exclusive in one rule.
  - name: both-alert-and-record
    rules:
      - alert: Confused
        record: also_confused
        expr: up == 0

  # 2. PromQL syntax error: an aggregation with no grouping parentheses.
  - name: bad-promql
    rules:
      - alert: BadExpression
        expr: sum by service (rate(http_requests_total[5m])) > 1
        for: 5m

  # 3. Duplicate group name (see group 1's sibling below) and a missing expr.
  - name: bad-promql
    rules:
      - alert: NoExpression
        for: 5m
        labels:
          severity: page

  # 4. `for` must be a duration, and severity must be a string not a bare word list.
  - name: bad-types
    rules:
      - alert: BadDuration
        expr: up == 0
        for: five minutes
        labels:
          severity: [critical, page]
Specifications
- Groups
- 4
- Distinct Faults
- 5
- Intentionally Invalid
- true
- Faults
- alert+record together, PromQL syntax, duplicate group name, missing expr, wrong types
- Parses As Yaml
- true
Testing contract
Expected to fail- Scenario
- Run rule validation over the file and collect every diagnostic.
- Expected result
- All five faults are reported with their group and rule names rather than validation stopping at the first, and the file still parses cleanly as YAML.
What is a .yaml file?
YAML (YAML Ain't Markup Language) is a human-readable data-serialization format using indentation, key-value pairs, and lists, and is a superset of JSON. It supports comments, anchors, and multiple documents per file, favoring readability for configuration. Its indentation sensitivity makes it error-prone to hand-edit.
How to use this file
Use an example YAML file to test config parsers, indentation and anchor handling, multi-document streams, and safe-loading to avoid arbitrary object construction.
How to use this file for testing
“Prometheus Alerting Rules — Intentionally Invalid, Five Distinct Faults (yaml)” is a deterministic Novus Examples fixture for Observability, Schema validation, Config testing. Structured and plain-text telemetry with known timestamps, levels, request identifiers, and error states for testing log ingestion, correlation, dashboards, and alert pipelines.
Documented properties for this file: YAML · 966 bytes. Compare results against paired or grouped companions on this page when present (clean↔damaged, searchable↔scanned, or format twins) so scores stay reproducible across runs.
Download the file once, keep the path stable in CI or local scripts, and treat the spec table as the contract: dimensions, seeds, field lists, and roles are intentional. Corrupt or invalid samples are labelled as such — expect parsers to fail loudly rather than silently accept them.
Telemetry fixtures use fixed trace IDs, span IDs, and timestamps so ingestion is reproducible run to run. Point your collector, parser, or query layer at the file and assert the documented span tree, metric families, or severity mix; service and host names are invented.
Code examples
import yaml  # pip install pyyaml

with open("prometheus-alerting-rules-invalid.yaml") as f:
    data = yaml.safe_load(f)
print(data)
Related files
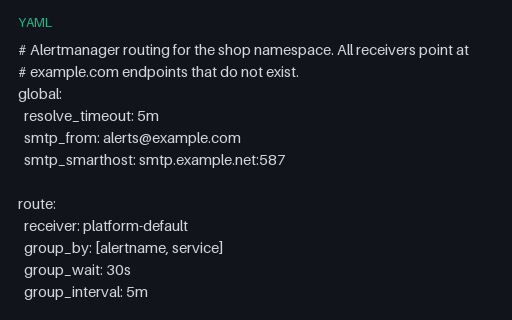
- yamlAlertmanager Config — Routing Tree, Inhibition and Mute Windows (yaml)An Alertmanager configuration with the routing behaviour that is hard to reason about without a fixture: a continue: true branch so a critical alert reaches two receivers, an inhibition rule suppressing warnings under a matching critical, and a weekend mute window.
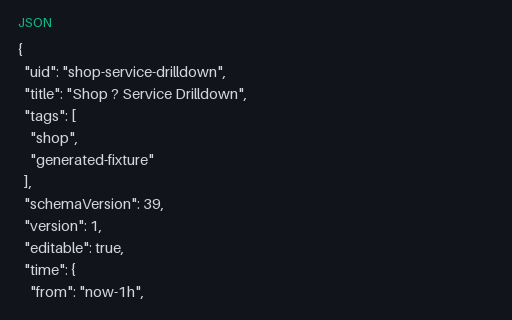
- jsonDashboard JSON — Chained Template Variables (json)A dashboard driven by four template variables, one of which queries using the value of another — the chained dependency that must be resolved in order. Multi-select variables interpolate as regex alternations, which is why every query here uses =~ rather than =.
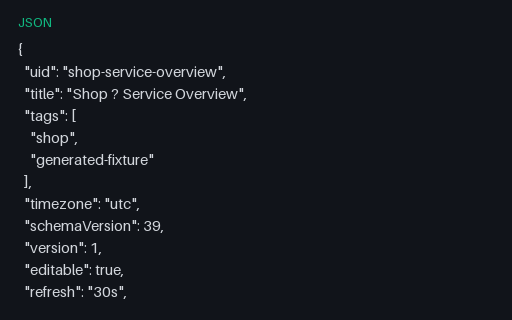
- jsonDashboard JSON — Five-Panel Service Overview (json)A dashboard document in the Grafana JSON model: five panels on the 24-column grid, each with a datasource reference by UID, a PromQL target and a unit. Three panels query the recording rules in this category, so the dashboard and the rule file can be validated against each other.
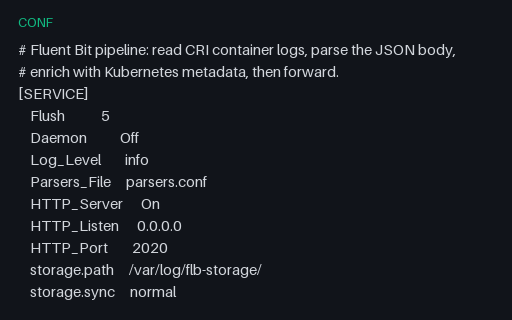
- confFluent Bit — Tail, Enrich and Forward Pipeline (conf)A Fluent Bit configuration in its INI-like section format: a tail input using the CRI multiline parser that reassembles the partial-line fixture, Kubernetes enrichment, a modify filter dropping two of the high-cardinality fields, and a throttle. Keys are space-aligned, not delimited.
- mdIncident Runbook — Checkout Latency SLO Burn (md)The runbook the alerting rules link to, written as a real one would be: confirm, localise, mitigate, close out, with a symptom table pointing at the trace and profile fixtures in this category. A realistic document for testing runbook linting, link checking and documentation pipelines.
- yamlOpenTelemetry Collector — Tail-Sampling Policies (yaml)Six tail-sampling policies including an inverted regex match that drops health checks and a composite policy with its own rate limit and ordered sub-policies. Policies are OR-ed and one match keeps the entire trace, which is the semantic most people get backwards.
Generated by generation/observability.py. Free for any use, no attribution required — license.