
Prometheus Alerting Rules — Four Rules Across Two Groups (yaml)
Four alerting rules over two groups, using the YAML features that break naive config readers: block scalars for multi-line PromQL, folded scalars for descriptions, Go template annotations with pipes, and keep_firing_for. Every expression references metrics that exist in this category's fixtures.
# Prometheus alerting rules for the shop namespace.
# Every expression references metric families that exist in this category's
# Prometheus and OpenMetrics fixtures.
groups:
  - name: shop-availability
    interval: 30s
    rules:
      - alert: TargetDown
        expr: up == 0
        for: 5m
        labels:
          severity: critical
          team: platform
        annotations:
          summary: "{{ $labels.job }} target {{ $labels.instance }} is down"
          description: >-
            Prometheus has been unable to scrape {{ $labels.instance }} for five
            minutes. Check the pod status before paging the service owner.
          runbook_url: https://runbooks.example.com/shop/target-down

      - alert: HighErrorRate
        expr: |
          sum by (service) (rate(http_requests_total{status=~"5.."}[5m]))
            /
          sum by (service) (rate(http_requests_total[5m]))
            > 0.05
        for: 10m
        labels:
          severity: warning
          team: shop
        annotations:
          summary: "{{ $labels.service }} is serving more than 5% 5xx"
          description: "Current ratio: {{ $value | humanizePercentage }}."

  - name: shop-latency
    interval: 30s
    rules:
      - alert: CheckoutLatencySLOBurn
        expr: |
          histogram_quantile(
            0.99,
            sum by (le, service) (rate(http_request_duration_seconds_bucket{service="checkout-api"}[5m]))
          ) > 1
        for: 15m
        keep_firing_for: 5m
        labels:
          severity: critical
          team: shop
          slo: checkout-latency
annotations:Specifications
- Groups
- 2
- Rules
- 4
- Multiline Expressions
- 2
- Has Keep Firing For
- true
- Has Runbook Urls
- 2
- Templated Annotations
- true
- Evaluation Interval
- 30s
Testing contract
Expected to pass- Scenario
- Load the file with promtool-style rule validation.
- Expected result
- Two groups and four rules load, the block-scalar expressions parse as valid PromQL, and the {{ $labels.job }} templates are preserved rather than being expanded at load time.
What is a .yaml file?
YAML (YAML Ain't Markup Language) is a human-readable data-serialization format using indentation, key-value pairs, and lists, and is a superset of JSON. It supports comments, anchors, and multiple documents per file, favoring readability for configuration. Its indentation sensitivity makes it error-prone to hand-edit.
How to use this file
Use an example YAML file to test config parsers, indentation and anchor handling, multi-document streams, and safe-loading to avoid arbitrary object construction.
How to use this file for testing
“Prometheus Alerting Rules — Four Rules Across Two Groups (yaml)” is a deterministic Novus Examples fixture for Observability, Config parsing, Config testing. Structured and plain-text telemetry with known timestamps, levels, request identifiers, and error states for testing log ingestion, correlation, dashboards, and alert pipelines.
Documented properties for this file: YAML · 2,037 bytes. Compare results against paired or grouped companions on this page when present (clean↔damaged, searchable↔scanned, or format twins) so scores stay reproducible across runs.
Download the file once, keep the path stable in CI or local scripts, and treat the spec table as the contract: dimensions, seeds, field lists, and roles are intentional. Corrupt or invalid samples are labelled as such — expect parsers to fail loudly rather than silently accept them.
Telemetry fixtures use fixed trace IDs, span IDs, and timestamps so ingestion is reproducible run to run. Point your collector, parser, or query layer at the file and assert the documented span tree, metric families, or severity mix; service and host names are invented.
Code examples
import yaml  # pip install pyyaml

with open("prometheus-alerting-rules.yaml") as f:
    data = yaml.safe_load(f)
print(data)
Related files
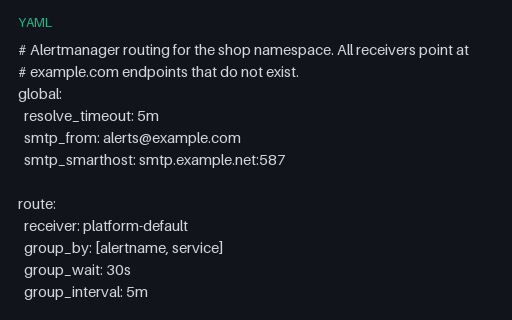
- yamlAlertmanager Config — Routing Tree, Inhibition and Mute Windows (yaml)An Alertmanager configuration with the routing behaviour that is hard to reason about without a fixture: a continue: true branch so a critical alert reaches two receivers, an inhibition rule suppressing warnings under a matching critical, and a weekend mute window.
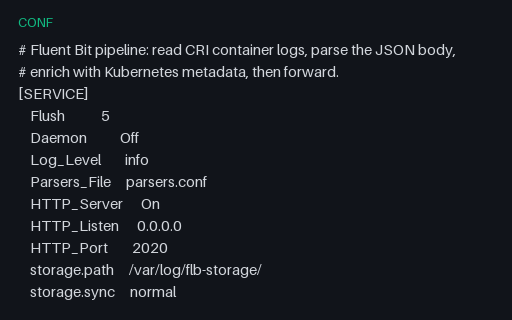
- confFluent Bit — Tail, Enrich and Forward Pipeline (conf)A Fluent Bit configuration in its INI-like section format: a tail input using the CRI multiline parser that reassembles the partial-line fixture, Kubernetes enrichment, a modify filter dropping two of the high-cardinality fields, and a throttle. Keys are space-aligned, not delimited.
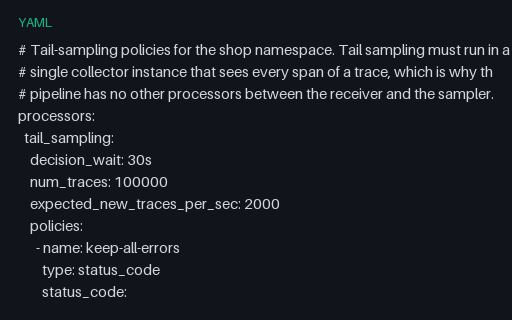
- yamlOpenTelemetry Collector — Tail-Sampling Policies (yaml)Six tail-sampling policies including an inverted regex match that drops health checks and a composite policy with its own rate limit and ordered sub-policies. Policies are OR-ed and one match keeps the entire trace, which is the semantic most people get backwards.
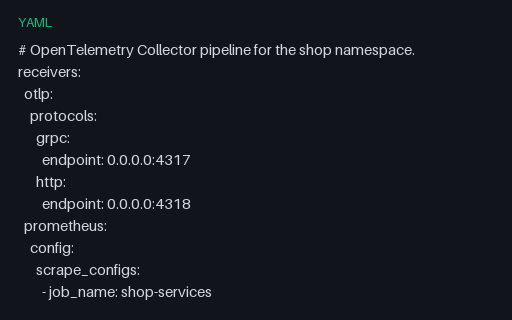
- yamlOpenTelemetry Collector — Three-Signal Pipeline Configuration (yaml)A Collector configuration wiring traces, metrics and logs through separate pipelines, with named component instances, a filelog receiver that parses the CRI log fixture, OTTL statements performing the semantic-convention migration from the paired trace fixtures, and a redaction processor.
- yamlPrometheus Scrape Config — Relabelling and Federation (yaml)Three scrape jobs with the parts that actually matter: relabel_configs rewriting a target label with a capture group, metric_relabel_configs dropping the two unbounded labels from the cardinality fixture, honor_timestamps for the textfile collector and a federation job with a match[] selector.
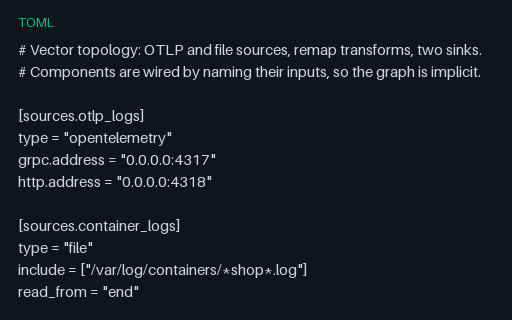
- tomlVector — Log Topology in TOML with Multi-Line Transforms (toml)A log-processing topology in TOML where components declare their inputs rather than an explicit graph, including a dropped-event route consumed as parse_json.dropped. The transform bodies are triple-quoted multi-line strings holding a different language, which is what breaks TOML tooling here.
Generated by generation/observability.py. Free for any use, no attribution required — license.