
Dashboard JSON — Five-Panel Service Overview (json)
A dashboard document in the Grafana JSON model: five panels on the 24-column grid, each with a datasource reference by UID, a PromQL target and a unit. Three panels query the recording rules in this category, so the dashboard and the rule file can be validated against each other.
{
  "uid": "shop-service-overview",
  "title": "Shop — Service Overview",
  "tags": [
    "shop",
    "generated-fixture"
  ],
  "timezone": "utc",
  "schemaVersion": 39,
  "version": 1,
  "editable": true,
  "refresh": "30s",
  "time": {
    "from": "now-6h",
    "to": "now"
  },
  "panels": [
    {
      "id": 1,
      "title": "Request rate",
      "type": "timeseries",
      "gridPos": {
        "x": 0,
        "y": 0,
        "w": 12,
        "h": 8
      },
      "datasource": {
        "type": "prometheus",
        "uid": "shop-prometheus"
      },
      "targets": [
        {
          "refId": "A",
          "expr": "service:http_requests:rate5m",
          "legendFormat": "{{service}}",
          "datasource": {
            "type": "prometheus",
            "uid": "shop-prometheus"
          }
        }
      ],
      "fieldConfig": {
        "defaults": {
          "unit": "reqps",
          "custom": {}
        },
        "overrides": []
      }
},Specifications
- Panels
- 5
- Panel Types
- timeseries, stat, heatmap
- Schema Version
- 39
- Datasource Uid
- shop-prometheus
- Uses Recording Rules
- 3
- Has Annotation Query
- true
- Grid Columns
- 24
Testing contract
Expected to pass- Scenario
- Import the dashboard and resolve every panel target against the rule fixtures.
- Expected result
- Five panels import with no overlapping grid positions, and all three recording-rule references resolve to rules defined in the recording-rules fixture.
What is a .json file?
JSON (JavaScript Object Notation) is a lightweight, text-based data-interchange format representing objects, arrays, strings, numbers, booleans, and null. It is language-independent, human-readable, and the dominant format for web APIs and configuration. It requires a single well-formed root value.
How to use this file
Use an example JSON file to test parsers and serializers, schema validation, Unicode and number-precision handling, and API request or response processing.
How to use this file for testing
“Dashboard JSON — Five-Panel Service Overview (json)” is a deterministic Novus Examples fixture for Observability, JSON parsing, Config testing. Structured and plain-text telemetry with known timestamps, levels, request identifiers, and error states for testing log ingestion, correlation, dashboards, and alert pipelines.
Documented properties for this file: JSON · 4,174 bytes. Compare results against paired or grouped companions on this page when present (clean↔damaged, searchable↔scanned, or format twins) so scores stay reproducible across runs.
Download the file once, keep the path stable in CI or local scripts, and treat the spec table as the contract: dimensions, seeds, field lists, and roles are intentional. Corrupt or invalid samples are labelled as such — expect parsers to fail loudly rather than silently accept them.
Telemetry fixtures use fixed trace IDs, span IDs, and timestamps so ingestion is reproducible run to run. Point your collector, parser, or query layer at the file and assert the documented span tree, metric families, or severity mix; service and host names are invented.
Code examples
import json

with open("grafana-dashboard-overview.json") as f:
    data = json.load(f)
print(type(data), len(data))
Related files
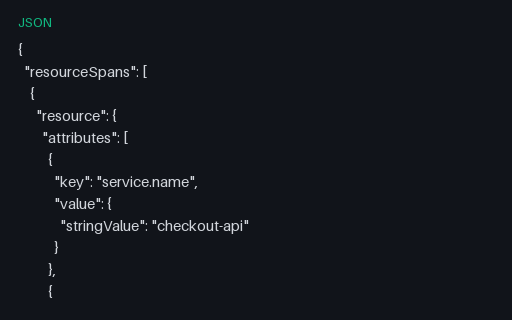
- jsonOTLP Trace — Head and Tail Sampling Attributes (json)A trace annotated with the sampling decision that let it through — sampler type and ratio on every span, plus a sampling.priority override on the root. The fixture for testing that a tail-sampling processor reads the existing decision instead of re-deciding and splitting the trace.
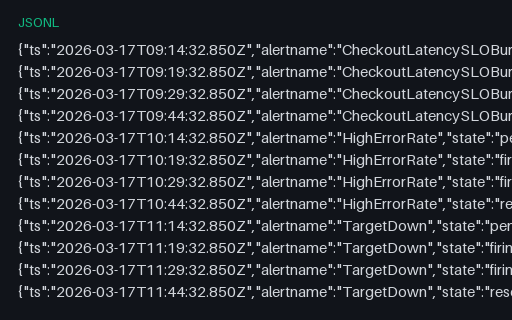
- jsonlAlert State History — Pending, Firing and Resolved Transitions (jsonl)Sixteen state transitions across four alerts, each moving inactive to pending to firing to resolved with the previous state recorded. The pending stage is where a for: duration is being served and no notification is sent, which is what makes alert-noise analysis possible.
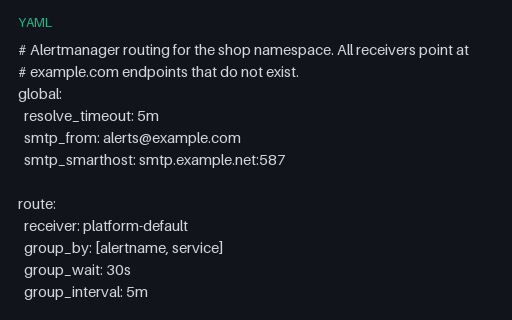
- yamlAlertmanager Config — Routing Tree, Inhibition and Mute Windows (yaml)An Alertmanager configuration with the routing behaviour that is hard to reason about without a fixture: a continue: true branch so a critical alert reaches two receivers, an inhibition rule suppressing warnings under a matching critical, and a weekend mute window.
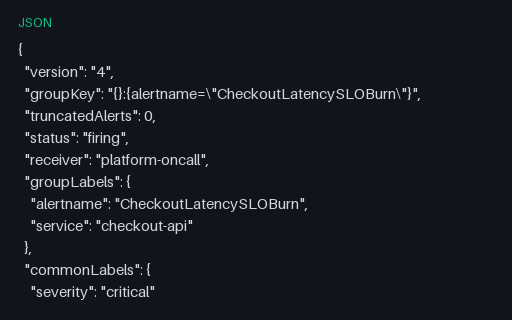
- jsonAlertmanager Webhook — Firing Notification (json)The JSON body Alertmanager POSTs to a webhook when an alert fires, including the detail that catches everyone: endsAt is Go's zero time rather than null or absent, so a receiver that parses it as a real timestamp records an alert that ended in the year 1.
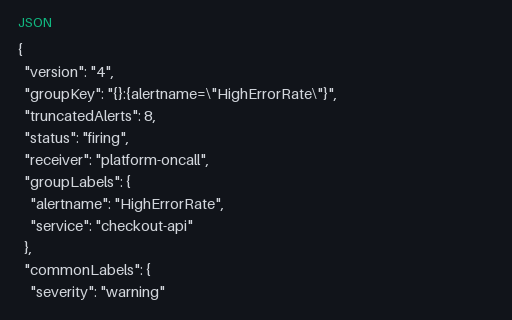
- jsonAlertmanager Webhook — Grouped Batch with Truncation (json)One notification carrying twelve grouped alerts with truncatedAlerts set to 8, meaning twenty were firing. Receivers that count the alerts array report a smaller incident than actually exists — the field is there precisely so that does not have to happen.
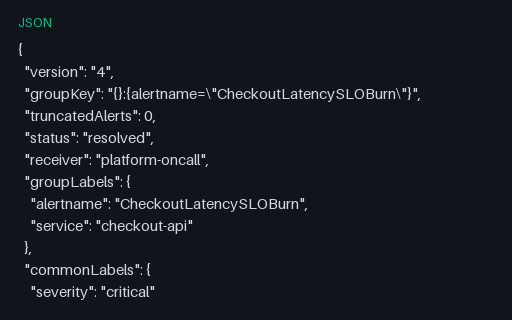
- jsonAlertmanager Webhook — Resolved Notification (json)The resolved notification for the same alert half an hour later, carrying an identical fingerprint and group key with endsAt now populated. Paired with the firing payload so incident-tracking code can be tested for correctly closing the incident it opened.
Generated by generation/observability.py. Free for any use, no attribution required — license.