Skip to content
Novus Examples

Explore the test library

Search files, editable visual templates, and live browser targets from one registry-backed directory. Filtered query views stay crawlable for links but are deliberately noindex; the stable taxonomy pages below remain the canonical search surfaces.

120 results

Page 1 of 5; 24 results per page.

Show the canonical directory
Preview of .NET Exception with an Inner Exception Chain (log)
log
1.1 KB
Actual file preview for .NET Exception with an Inner Exception Chain (log)

.NET Exception with an Inner Exception Chain (log)

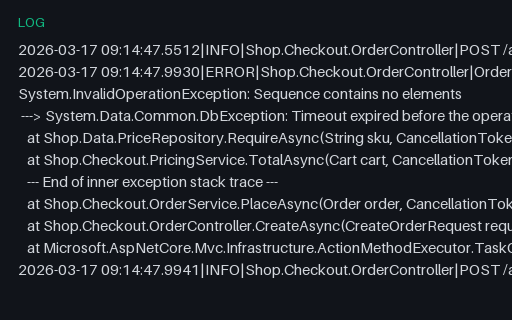
A .NET exception whose inner exception is introduced by the ---> marker and closed by End of inner exception stack trace, wrapped in pipe-delimited log lines. Error groupers that key on the outermost message alone merge two genuinely different faults here.

File
LOG · Logs
Use case
ObservabilityLog parsing+1· Conversion set
Preview of Alert State History — Pending, Firing and Resolved Transitions (jsonl)
jsonl
3.9 KB
Actual file preview for Alert State History — Pending, Firing and Resolved Transitions (jsonl)

Alert State History — Pending, Firing and Resolved Transitions (jsonl)

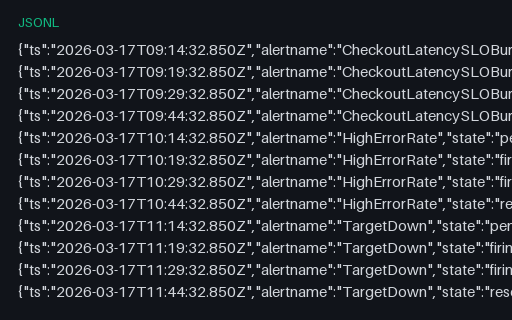
Sixteen state transitions across four alerts, each moving inactive to pending to firing to resolved with the previous state recorded. The pending stage is where a for: duration is being served and no notification is sent, which is what makes alert-noise analysis possible.

File
JSONL · Alerts
Preview of Alertmanager Config — Routing Tree, Inhibition and Mute Windows (yaml)
yaml
1.4 KB
Actual file preview for Alertmanager Config — Routing Tree, Inhibition and Mute Windows (yaml)

Alertmanager Config — Routing Tree, Inhibition and Mute Windows (yaml)

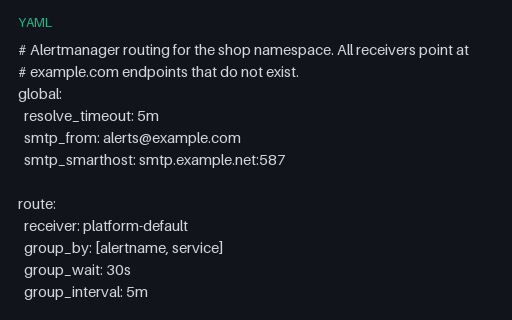
An Alertmanager configuration with the routing behaviour that is hard to reason about without a fixture: a continue: true branch so a critical alert reaches two receivers, an inhibition rule suppressing warnings under a matching critical, and a weekend mute window.

File
YAML · Alerts
Preview of Alertmanager Webhook — Firing Notification (json)
json
1.2 KB
Actual file preview for Alertmanager Webhook — Firing Notification (json)

Alertmanager Webhook — Firing Notification (json)

The JSON body Alertmanager POSTs to a webhook when an alert fires, including the detail that catches everyone: endsAt is Go's zero time rather than null or absent, so a receiver that parses it as a real timestamp records an alert that ended in the year 1.

File
JSON · Alerts
Use case
ObservabilityJSON parsing+1· Paired fixture
Preview of Alertmanager Webhook — Grouped Batch with Truncation (json)
json
7.3 KB
Actual file preview for Alertmanager Webhook — Grouped Batch with Truncation (json)

Alertmanager Webhook — Grouped Batch with Truncation (json)

One notification carrying twelve grouped alerts with truncatedAlerts set to 8, meaning twenty were firing. Receivers that count the alerts array report a smaller incident than actually exists — the field is there precisely so that does not have to happen.

File
JSON · Alerts
Preview of Alertmanager Webhook — Resolved Notification (json)
json
1.2 KB
Actual file preview for Alertmanager Webhook — Resolved Notification (json)

Alertmanager Webhook — Resolved Notification (json)

The resolved notification for the same alert half an hour later, carrying an identical fingerprint and group key with endsAt now populated. Paired with the firing payload so incident-tracking code can be tested for correctly closing the incident it opened.

File
JSON · Alerts
Use case
ObservabilityJSON parsing+1· Paired fixture
Preview of Allocation Profile — Folded Stacks Weighted in Bytes (txt)
txt
404 B
Actual file preview for Allocation Profile — Folded Stacks Weighted in Bytes (txt)

Allocation Profile — Folded Stacks Weighted in Bytes (txt)

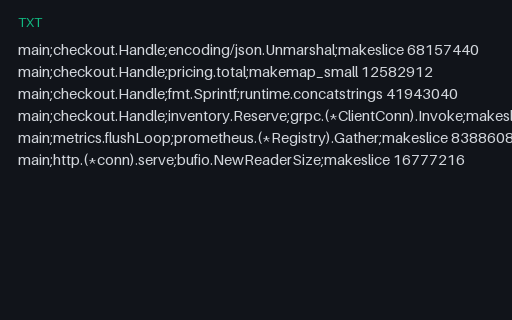
An allocation profile in the same folded syntax as the CPU profiles, but weighted in bytes rather than samples. The format carries no unit, so a viewer that assumes samples renders 65 MB of allocation as 68 million samples — which is what this fixture is for.

File
TXT · Profiles
Use case
ObservabilityPerformance testing+1· Conversion set
Preview of B3 Propagation — Single and Multi-Header Forms (txt)
txt
892 B
Actual file preview for B3 Propagation — Single and Multi-Header Forms (txt)

B3 Propagation — Single and Multi-Header Forms (txt)

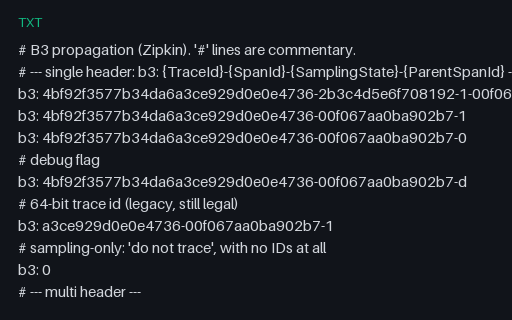
B3 context propagation in both shapes — the compact single b3 header including the debug flag, a legacy 64-bit trace ID and the sampling-only form, plus the five X-B3-* multi-header fields — with two malformed values that must be rejected.

File
TXT · Traces
Use case
ObservabilitySchema validation+1· Conversion set
Preview of Chrome DevTools CPU Profile — Node Tree with Sample Deltas (json)
json
2.8 KB
Actual file preview for Chrome DevTools CPU Profile — Node Tree with Sample Deltas (json)

Chrome DevTools CPU Profile — Node Tree with Sample Deltas (json)

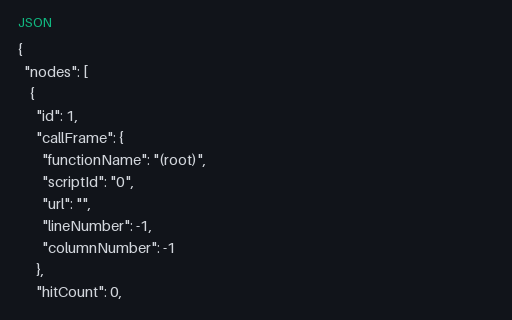
The .cpuprofile shape V8 emits: a node tree with call frames, a samples array of node IDs and a parallel timeDeltas array, plus the synthesized (idle), (program) and (garbage collector) nodes. Counting those synthetic frames as application time is the classic misreading.

File
JSON · Profiles
Use case
ObservabilityJSON parsing+1· Conversion set
Preview of CPU Profile — Folded Stacks After a Regression (txt)
txt
1.3 KB
Actual file preview for CPU Profile — Folded Stacks After a Regression (txt)

CPU Profile — Folded Stacks After a Regression (txt)

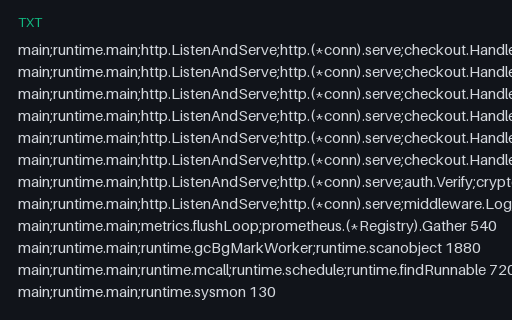
The same workload after a change: JSON decoding costs four times as much and gains a new reflect frame, while cache lookups get cheaper. Paired with the baseline so a differential flamegraph can be scored against a known regression and a known improvement.

File
TXT · Profiles
Use case
ObservabilityPerformance testing+1· Paired fixture
Preview of CPU Profile — Folded Stacks, Baseline (txt)
txt
1.2 KB
Actual file preview for CPU Profile — Folded Stacks, Baseline (txt)

CPU Profile — Folded Stacks, Baseline (txt)

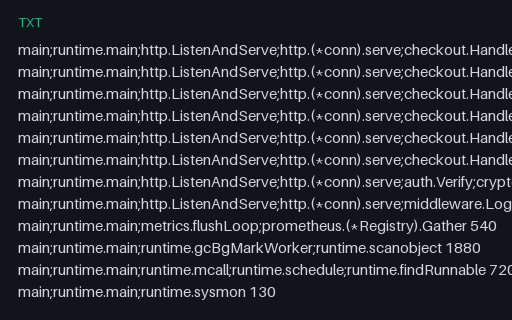
A CPU profile in the folded-stack format every flamegraph tool reads: one line per unique stack, frames separated by semicolons, then a space and a sample count. Twelve stacks up to seven frames deep, with the runtime's GC and scheduler work included as real profiles have.

File
TXT · Profiles
Use case
ObservabilityPerformance testing+1· Paired fixture
Preview of CRI Container Log — Partial Lines and Two Streams (log)
log
800 B
Actual file preview for CRI Container Log — Partial Lines and Two Streams (log)

CRI Container Log — Partial Lines and Two Streams (log)

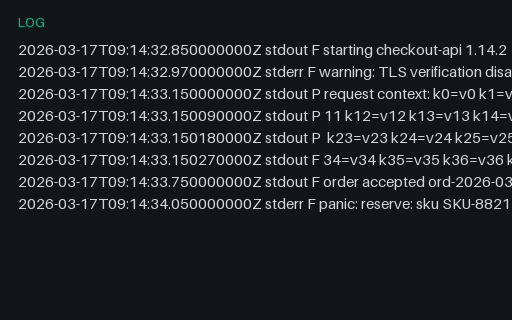
The CRI log format Kubernetes nodes actually write: an RFC 3339 nanosecond timestamp, a stream name, and an F or P tag marking whether the line is full or a partial continuation. One long message is split across several P lines that must be rejoined before parsing.

File
LOG · Logs
Use case
ObservabilityLog parsing+1· Conversion set
Preview of Dashboard JSON — Chained Template Variables (json)
json
3 KB
Actual file preview for Dashboard JSON — Chained Template Variables (json)

Dashboard JSON — Chained Template Variables (json)

A dashboard driven by four template variables, one of which queries using the value of another — the chained dependency that must be resolved in order. Multi-select variables interpolate as regex alternations, which is why every query here uses =~ rather than =.

File
JSON · Alerts
Use case
ObservabilityJSON parsing+1· Conversion set
Preview of Dashboard JSON — Five-Panel Service Overview (json)
json
4.1 KB
Actual file preview for Dashboard JSON — Five-Panel Service Overview (json)

Dashboard JSON — Five-Panel Service Overview (json)

A dashboard document in the Grafana JSON model: five panels on the 24-column grid, each with a datasource reference by UID, a PromQL target and a unit. Three panels query the recording rules in this category, so the dashboard and the rule file can be validated against each other.

File
JSON · Alerts
Use case
ObservabilityJSON parsing+1· Conversion set
Preview of Envoy-Style Proxy Access Log — JSON Lines (jsonl)
jsonl
18.8 KB
Actual file preview for Envoy-Style Proxy Access Log — JSON Lines (jsonl)

Envoy-Style Proxy Access Log — JSON Lines (jsonl)

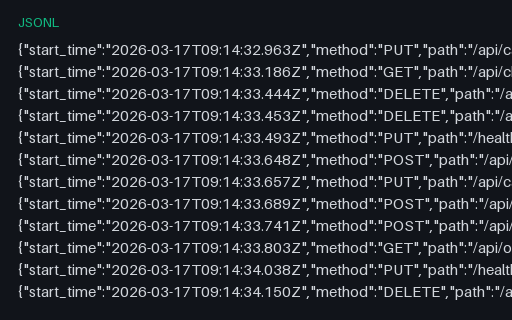
Forty service-mesh proxy access records with the fields that make mesh debugging possible: response_flags distinguishing an upstream failure from an overflow, upstream_service_time against total duration, upstream host and cluster, and a request ID for correlation.

File
JSONL · Logs
Use case
ObservabilityLog parsing+1· Conversion set
Preview of Flamegraph Hierarchy — Nested name/value/children Tree (json)
json
4.6 KB
Actual file preview for Flamegraph Hierarchy — Nested name/value/children Tree (json)

Flamegraph Hierarchy — Nested name/value/children Tree (json)

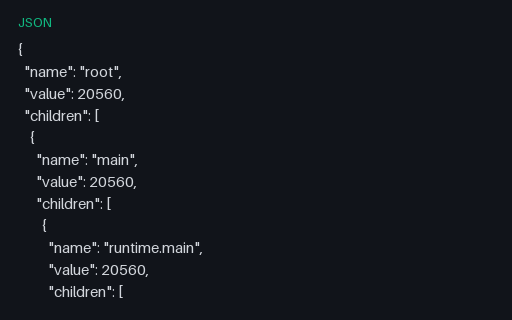
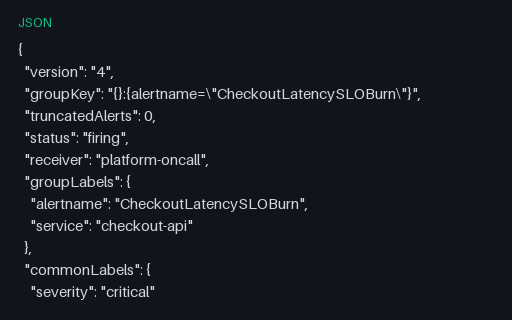
The folded CPU profile after aggregation into the nested name, value and children hierarchy that d3-flame-graph and most web viewers consume. Every node's value equals its own self time plus its children's, which is the invariant a converter must preserve.

File
JSON · Profiles
Use case
ObservabilityJSON parsing+1· Conversion set
Preview of Fluent Bit — Tail, Enrich and Forward Pipeline (conf)
conf
1.4 KB
Actual file preview for Fluent Bit — Tail, Enrich and Forward Pipeline (conf)

Fluent Bit — Tail, Enrich and Forward Pipeline (conf)

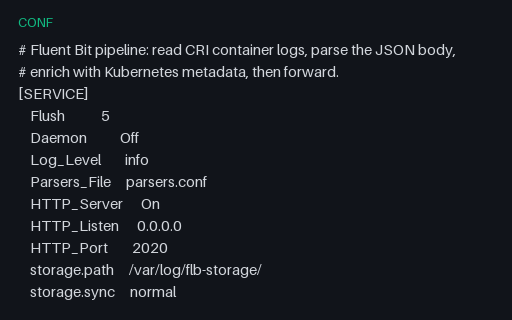
A Fluent Bit configuration in its INI-like section format: a tail input using the CRI multiline parser that reassembles the partial-line fixture, Kubernetes enrichment, a modify filter dropping two of the high-cardinality fields, and a throttle. Keys are space-aligned, not delimited.

File
CONF · Alerts
Use case
ObservabilityConfig parsing+1· Conversion set
Preview of Go Panic with Full Goroutine Dump (log)
log
879 B
Actual file preview for Go Panic with Full Goroutine Dump (log)

Go Panic with Full Goroutine Dump (log)

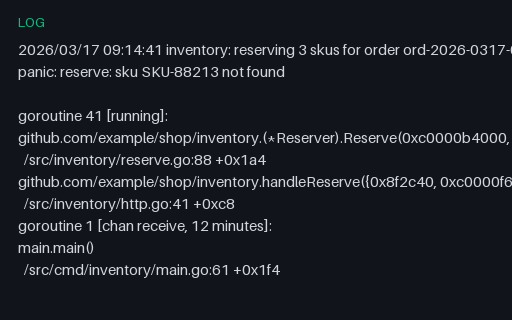
A Go panic followed by the runtime's full goroutine dump — four goroutines with their wait states, two-line frames and a created by attribution, separated by blank lines. Blank-line separation defeats multi-line rules that treat an empty line as the end of an event.

File
LOG · Logs
Use case
ObservabilityLog parsing+1· Conversion set
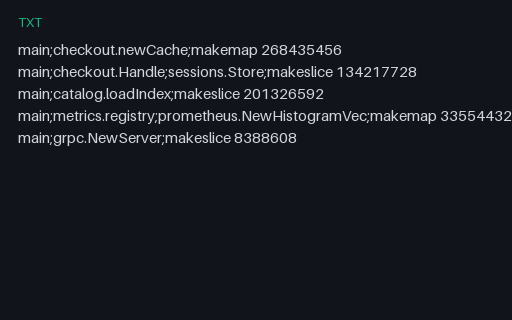
Preview of Heap Profile — In-Use Bytes by Allocation Site (txt)
txt
244 B
Actual file preview for Heap Profile — In-Use Bytes by Allocation Site (txt)

Heap Profile — In-Use Bytes by Allocation Site (txt)

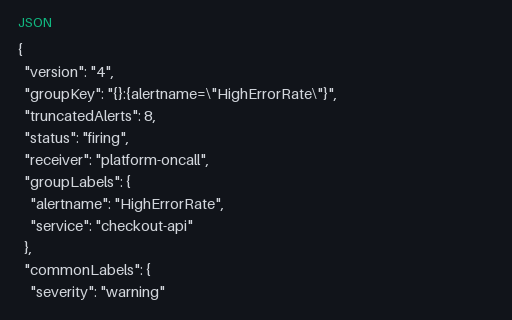
A heap profile measuring bytes still live at the sample point, not bytes ever allocated — which is why its shape differs from the allocation profile of the same process. 620 MB retained across five sites, with an unbounded session cache at the top.

File
TXT · Profiles
Use case
ObservabilityPerformance testing+1· Conversion set
Preview of Incident Runbook — Checkout Latency SLO Burn (md)
md
2 KB
Actual file preview for Incident Runbook — Checkout Latency SLO Burn (md)

Incident Runbook — Checkout Latency SLO Burn (md)

The runbook the alerting rules link to, written as a real one would be: confirm, localise, mitigate, close out, with a symptom table pointing at the trace and profile fixtures in this category. A realistic document for testing runbook linting, link checking and documentation pipelines.

File
MD · Alerts
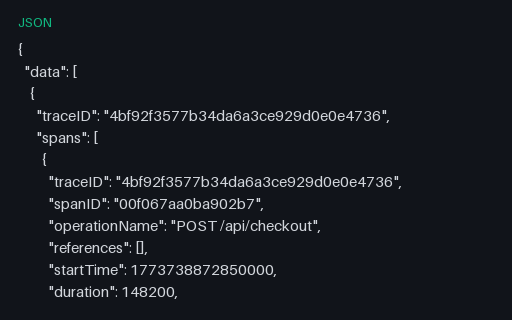
Preview of Jaeger JSON Trace — Same 13-Span Checkout (json)
json
22.2 KB
Actual file preview for Jaeger JSON Trace — Same 13-Span Checkout (json)

Jaeger JSON Trace — Same 13-Span Checkout (json)

The checkout trace in the Jaeger query-API shape — a data array holding one trace, spans carrying microsecond startTime and duration, CHILD_OF references, typed tags and a per-service processes map. The same span tree as the OTLP and Zipkin twins, so a converter can be scored exactly.

File
JSON · Traces
Use case
ObservabilityJSON parsing+1· Conversion set
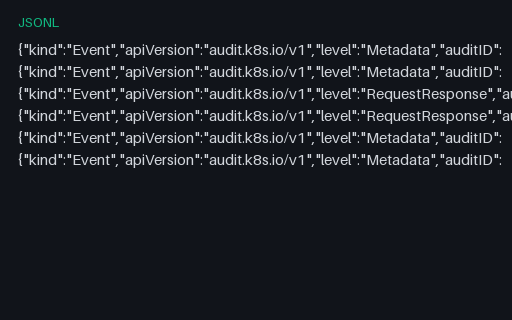
Preview of Kubernetes Audit Log — Six Events with an RBAC Denial (jsonl)
jsonl
4 KB
Actual file preview for Kubernetes Audit Log — Six Events with an RBAC Denial (jsonl)

Kubernetes Audit Log — Six Events with an RBAC Denial (jsonl)

Six Kubernetes audit events at two audit levels, including one 403 whose authorization annotations record the forbid decision and its reason. The shape a cluster-audit alert or compliance report reads, with every user and service account invented.

File
JSONL · Logs
Use case
ObservabilityLog parsing+1· Conversion set
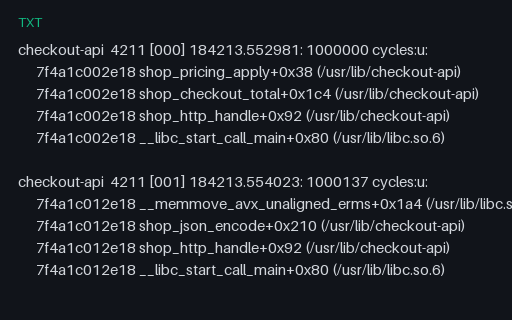
Preview of Linux perf script — Sample Records with Call Chains (txt)
txt
2.6 KB
Actual file preview for Linux perf script — Sample Records with Call Chains (txt)

Linux perf script — Sample Records with Call Chains (txt)

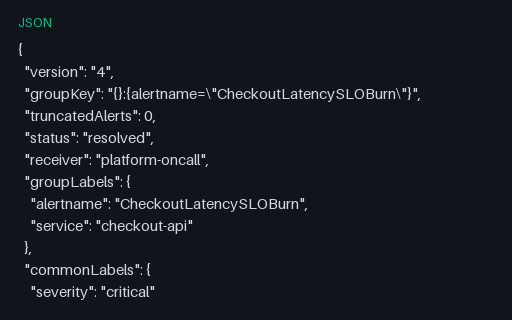
Raw perf script output — a header line per sample followed by tab-indented call-chain frames with addresses, symbols, offsets and DSO paths, samples separated by blank lines. The input side of stackcollapse, including unresolved frames a symbolizer could not name.

File
TXT · Profiles
Use case
ObservabilityPerformance testing+1· Conversion set
Preview of logfmt — Quoting, Escaping and Bare-Key Edge Cases (log)
log
882 B
Actual file preview for logfmt — Quoting, Escaping and Bare-Key Edge Cases (log)

logfmt — Quoting, Escaping and Bare-Key Edge Cases (log)

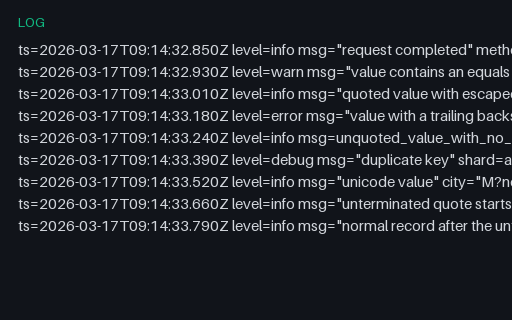
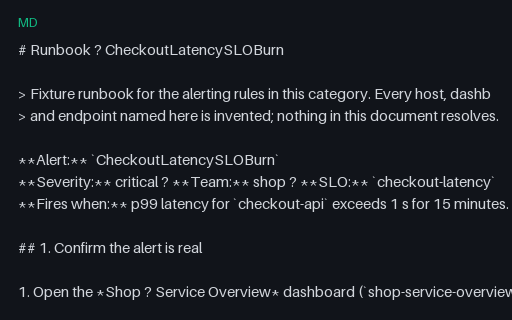
logfmt lines built to break naive splitting on spaces and equals signs: a value containing an equals sign, escaped quotes, a trailing backslash before the closing quote, a bare key with no value, duplicate keys, non-ASCII values and one unterminated quote followed by a clean line.

File
LOG · Logs
Use case
ObservabilityLog parsing+1· Conversion set