Skip to content
Novus Examples

Explore the test library

Search files, editable visual templates, and live browser targets from one registry-backed directory. Filtered query views stay crawlable for links but are deliberately noindex; the stable taxonomy pages below remain the canonical search surfaces.

120 results

Page 3 of 5; 24 results per page.

Show the canonical directory
Preview of OTLP Trace — ERROR Status and Exception Event (json)
json
29.8 KB
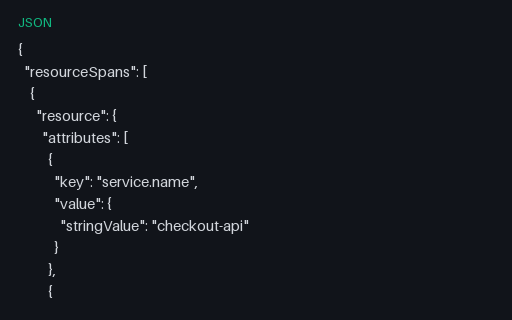
Actual file preview for OTLP Trace — ERROR Status and Exception Event (json)

OTLP Trace — ERROR Status and Exception Event (json)

A failed checkout: an upstream payment timeout sets ERROR status on four spans up the chain and attaches an exception event whose exception.stacktrace attribute holds a real multi-line Python traceback with embedded newlines. The fixture for error grouping, status propagation and multi-line attribute rendering.

File
JSON · Traces
Preview of OTLP Trace — Head and Tail Sampling Attributes (json)
json
26.4 KB
Actual file preview for OTLP Trace — Head and Tail Sampling Attributes (json)

OTLP Trace — Head and Tail Sampling Attributes (json)

A trace annotated with the sampling decision that let it through — sampler type and ratio on every span, plus a sampling.priority override on the root. The fixture for testing that a tail-sampling processor reads the existing decision instead of re-deciding and splitting the trace.

File
JSON · Traces
Preview of OTLP Trace — Legacy HTTP Semantic Conventions (json)
json
4.5 KB
Actual file preview for OTLP Trace — Legacy HTTP Semantic Conventions (json)

OTLP Trace — Legacy HTTP Semantic Conventions (json)

One HTTP server span using the old OpenTelemetry attribute names — http.method, http.url, http.status_code, net.peer.ip — and the old low-cardinality span name. Paired with its modern twin so a migration shim can be tested against a known before-and-after.

File
JSON · Traces
Use case
ObservabilityConversion testing+1· Paired fixture
Preview of OTLP Trace — Negative and Zero Durations, Intentionally Invalid (json)
json
12.6 KB
Actual file preview for OTLP Trace — Negative and Zero Durations, Intentionally Invalid (json)

OTLP Trace — Negative and Zero Durations, Intentionally Invalid (json)

One span ends 8.4 ms before it started and another has identical start and end timestamps. Intentionally invalid: negative durations poison latency aggregates — a single one can drag a p99 below zero — so this is the fixture for the validation that must sit in front of any duration metric.

File
JSON · Traces
Use case
ObservabilitySchema validation+1· Conversion set
Preview of OTLP Trace — Orphan Span with a Missing Parent (json)
json
26.7 KB
Actual file preview for OTLP Trace — Orphan Span with a Missing Parent (json)

OTLP Trace — Orphan Span with a Missing Parent (json)

The checkout trace with one intermediate span dropped, as happens when an exporter's queue overflows. Three spans now reference a parent that is not in the payload — a partial trace that a store must render rather than reject.

File
JSON · Traces
Use case
ObservabilityError handling+1· Conversion set
Preview of OTLP Trace — Span Links from a Batch Consumer (json)
json
5.7 KB
Actual file preview for OTLP Trace — Span Links from a Batch Consumer (json)

OTLP Trace — Span Links from a Batch Consumer (json)

The consumer half of the checkout flow, in its own trace. Its root CONSUMER span carries a link — not a parent reference — back to the producer span in the checkout trace, which is how a batching consumer joins work produced elsewhere. A fixture for link resolution and cross-trace navigation.

File
JSON · Traces
Preview of OTLP Trace — Spans Batched in Reverse Completion Order (json)
json
27.9 KB
Actual file preview for OTLP Trace — Spans Batched in Reverse Completion Order (json)

OTLP Trace — Spans Batched in Reverse Completion Order (json)

The canonical checkout trace with its spans emitted in the order they finished — children before parents, deepest first. This is what a real batch exporter produces, and a consumer that assumes parents arrive first will drop or orphan most of the trace.

File
JSON · Traces
Use case
ObservabilityJSON parsing+1· Conversion set
Preview of OTLP Trace — Stable HTTP Semantic Conventions (json)
json
4.6 KB
Actual file preview for OTLP Trace — Stable HTTP Semantic Conventions (json)

OTLP Trace — Stable HTTP Semantic Conventions (json)

The same HTTP server span written with the stable attribute names — http.request.method, url.path, http.response.status_code, client.address — and the route-templated span name the stable conventions require. The target state for a migration shim.

File
JSON · Traces
Use case
ObservabilityConversion testing+1· Paired fixture
Preview of OTLP Trace — Stock proto3 JSON Encoding (base64 IDs) (json)
json
28 KB
Actual file preview for OTLP Trace — Stock proto3 JSON Encoding (base64 IDs) (json)

OTLP Trace — Stock proto3 JSON Encoding (base64 IDs) (json)

The same 13-span trace serialised the way a stock proto3 JSON marshaller writes it: trace and span IDs base64-encoded and span kind and status as enum names rather than numbers. Paired with the hex/numeric OTLP/JSON twin so a receiver can be tested against both encodings of one payload.

File
JSON · Traces
Use case
ObservabilityJSON parsing+1· Paired fixture
Preview of OTLP Trace — Truncated Mid-Object, Intentionally Corrupt (json)
json
1.7 KB
Actual file preview for OTLP Trace — Truncated Mid-Object, Intentionally Corrupt (json)

OTLP Trace — Truncated Mid-Object, Intentionally Corrupt (json)

An OTLP/JSON export cut off in the middle of an object, the way a file sink looks when the collector is killed mid-write. This file is intentionally corrupt and small: it exists so an ingestion path can be tested for a clean parse error with a byte offset instead of a hang or a half-committed batch.

File
JSON · Traces
Preview of OTLP Traces — NDJSON Stream, One Resource per Line (jsonl)
jsonl
14.6 KB
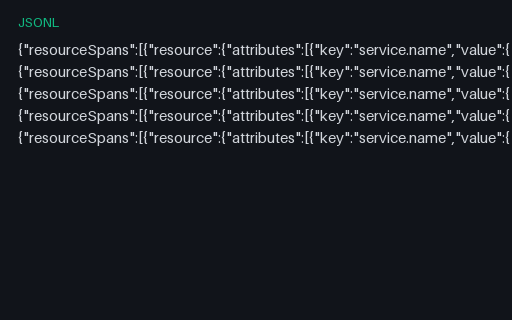
Actual file preview for OTLP Traces — NDJSON Stream, One Resource per Line (jsonl)

OTLP Traces — NDJSON Stream, One Resource per Line (jsonl)

Two traces streamed as newline-delimited OTLP requests, one resource per line, so a single trace is split across several lines exactly as a line-oriented collector sink writes it. A fixture for streaming ingestion, back-pressure and partial-trace assembly.

File
JSONL · Traces
Preview of OTLP/JSON Trace — 13-Span Checkout Request (json)
json
27.9 KB
Actual file preview for OTLP/JSON Trace — 13-Span Checkout Request (json)

OTLP/JSON Trace — 13-Span Checkout Request (json)

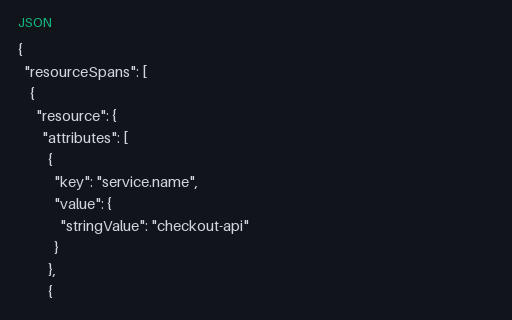
A complete OTLP/JSON trace export: one checkout request across five services as 13 spans, four levels deep, with HTTP, database, RPC and messaging semantic-convention attributes, span events and a producer span. Trace and span IDs are fixed, so ingesting it twice produces identical output.

File
JSON · Traces
Use case
ObservabilityJSON parsing+1· Paired fixture
Preview of Plain-Text Log — ANSI Colour Codes in the Stream (log)
log
623 B
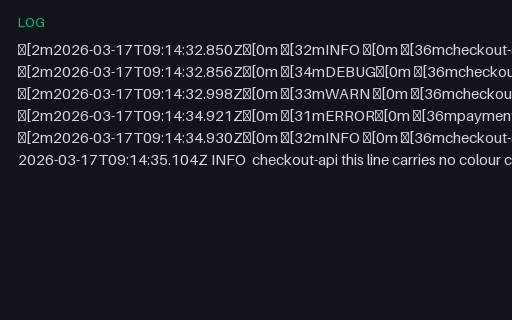
Actual file preview for Plain-Text Log — ANSI Colour Codes in the Stream (log)

Plain-Text Log — ANSI Colour Codes in the Stream (log)

A developer-mode log where the level and service are wrapped in ANSI colour codes, ending with one uncoloured line. Colour codes sit inside the field a parser wants to read, so level extraction fails unless the sequences are stripped first — the classic symptom of a container run without a TTY check.

File
LOG · Logs
Use case
ObservabilityLog parsing+1· Conversion set
Preview of Plain-Text Log — Mixed CRLF and LF Line Endings (log)
log
500 B
Actual file preview for Plain-Text Log — Mixed CRLF and LF Line Endings (log)

Plain-Text Log — Mixed CRLF and LF Line Endings (log)

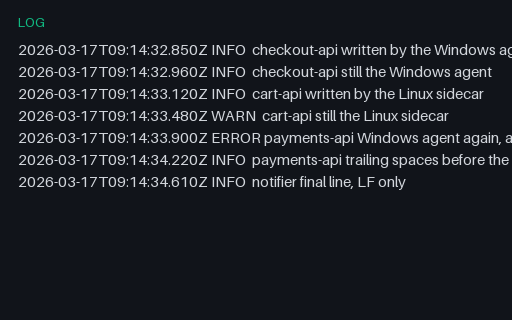
One log file written by two agents, four lines ending CRLF and three LF, with one line carrying trailing spaces before its break. Splitting on \n alone leaves a stray carriage return at the end of four fields, which is how a level or status ends up with an invisible character attached.

File
LOG · Logs
Use case
ObservabilityLog parsing+1· Conversion set
Preview of Plain-Text Log — Multi-Line Events Needing Line Joining (log)
log
1.9 KB
Actual file preview for Plain-Text Log — Multi-Line Events Needing Line Joining (log)

Plain-Text Log — Multi-Line Events Needing Line Joining (log)

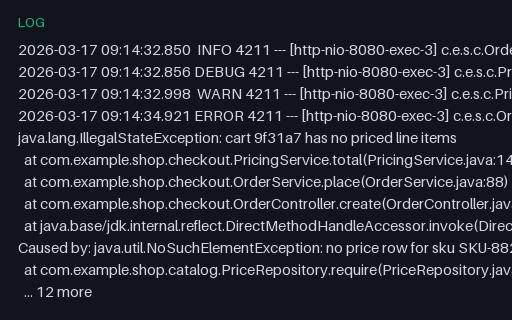
A Spring-style text log where two stack traces span many physical lines. Eight logical events across a larger number of lines, so a shipper's multi-line rule — anything not starting with a timestamp continues the previous event — can be scored against a known answer.

File
LOG · Logs
Use case
ObservabilityLog parsing+1· Conversion set
Preview of Plain-Text Log — No Trailing Newline on the Last Line (log)
log
245 B
Actual file preview for Plain-Text Log — No Trailing Newline on the Last Line (log)

Plain-Text Log — No Trailing Newline on the Last Line (log)

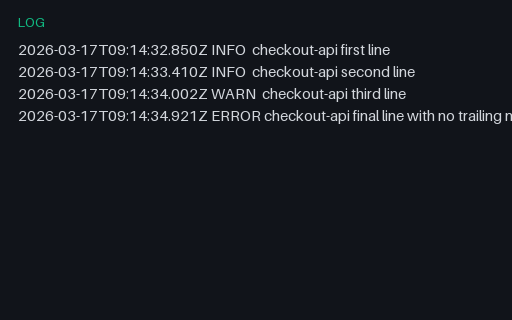
Four log lines where the last has no terminating newline — the normal state of any file still open for append. A tailer that only emits on seeing a newline holds that fourth line forever, which is why the newest error is the one missing from the dashboard.

File
LOG · Logs
Use case
ObservabilityLog parsing+1· Conversion set
Preview of Plain-Text Log — NUL, Control Bytes and Invalid UTF-8 (log)
log
421 B
Actual file preview for Plain-Text Log — NUL, Control Bytes and Invalid UTF-8 (log)

Plain-Text Log — NUL, Control Bytes and Invalid UTF-8 (log)

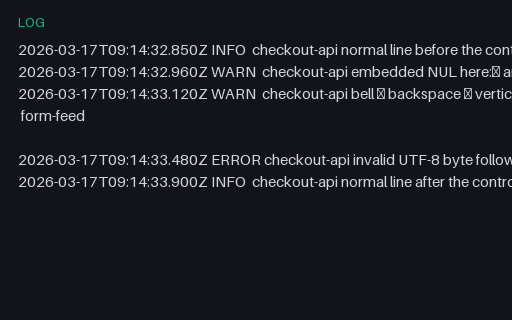
Five log lines carrying a NUL byte, bell, backspace, vertical tab and form feed, plus one 0xFF byte that is not valid UTF-8 — the debris that arrives when binary data reaches a log field. Deliberately contains no terminal-escape sequences, only inert control bytes.

File
LOG · Logs
Use case
ObservabilityLog parsing+1· Conversion set
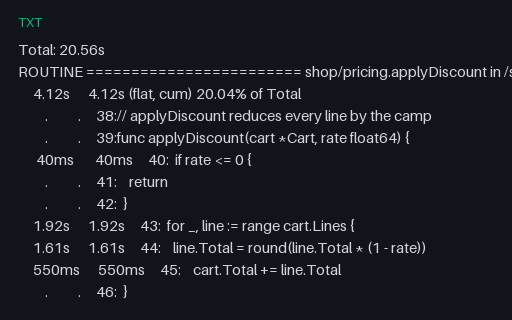
Preview of pprof — Annotated Source Listing (txt)
txt
1.1 KB
Actual file preview for pprof — Annotated Source Listing (txt)

pprof — Annotated Source Listing (txt)

Line-level profile output: two routines with per-source-line flat and cumulative cost, a dot for lines that cost nothing, and units that switch between seconds and milliseconds within one column. Source lines keep their real tabs, which most column parsers do not survive.

File
TXT · Profiles
Use case
ObservabilityPerformance testing+1· Conversion set
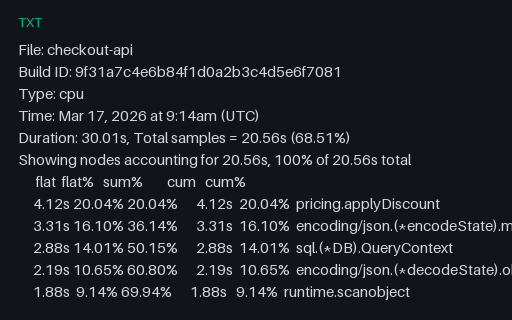
Preview of pprof — Top Report Text Output (txt)
txt
2 KB
Actual file preview for pprof — Top Report Text Output (txt)

pprof — Top Report Text Output (txt)

The text report pprof prints for the same profile as the folded fixtures: a metadata header, then flat and cumulative columns where frames that are never a leaf carry zero flat time and near-total cumulative time. Column-aligned output with a bare 0 rather than 0s, which is where naive column parsing fails.

File
TXT · Profiles · 28 rows
Use case
ObservabilityPerformance testing+1· Conversion set
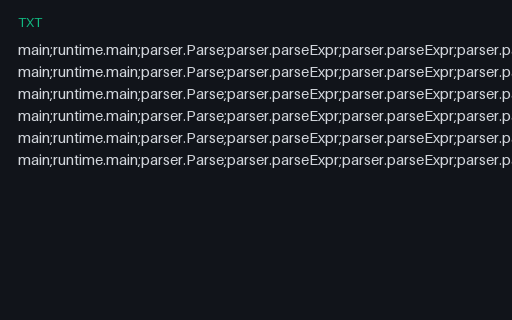
Preview of Profile — 200-Frame Recursive Stack (txt)
txt
13.5 KB
Actual file preview for Profile — 200-Frame Recursive Stack (txt)

Profile — 200-Frame Recursive Stack (txt)

A recursive-descent parser profiled mid-recursion: stacks up to 204 frames deep where one frame repeats 200 times, on lines over 3,000 characters. Flamegraph renderers with a fixed depth limit truncate this silently, and line-length limits split it into nonsense.

File
TXT · Profiles
Use case
ObservabilityPerformance testing+1· Conversion set
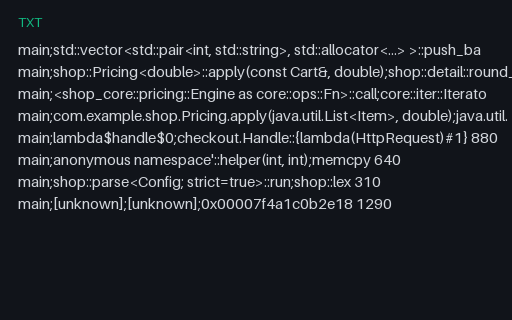
Preview of Profile — Demangled Symbols That Break the Folded Format (txt)
txt
618 B
Actual file preview for Profile — Demangled Symbols That Break the Folded Format (txt)

Profile — Demangled Symbols That Break the Folded Format (txt)

Demangled C++ templates, Rust trait impls, Java generics, lambdas and unresolved hex addresses in the folded format — including one symbol containing a semicolon, which the format has no way to escape. That line is genuinely ambiguous, and how a parser handles it is the point.

File
TXT · Profiles
Use case
ObservabilityLog parsing+1· Conversion set
Preview of Prometheus Alerting Rules — Four Rules Across Two Groups (yaml)
yaml
2 KB
Actual file preview for Prometheus Alerting Rules — Four Rules Across Two Groups (yaml)

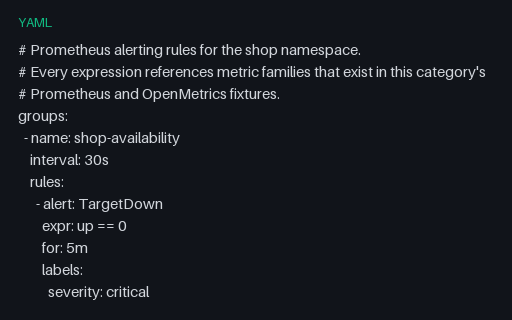
Prometheus Alerting Rules — Four Rules Across Two Groups (yaml)

Four alerting rules over two groups, using the YAML features that break naive config readers: block scalars for multi-line PromQL, folded scalars for descriptions, Go template annotations with pipes, and keep_firing_for. Every expression references metrics that exist in this category's fixtures.

File
YAML · Alerts
Use case
ObservabilityConfig parsing+1· Conversion set
Preview of Prometheus Alerting Rules — Intentionally Invalid, Five Distinct Faults (yaml)
yaml
966 B
Actual file preview for Prometheus Alerting Rules — Intentionally Invalid, Five Distinct Faults (yaml)

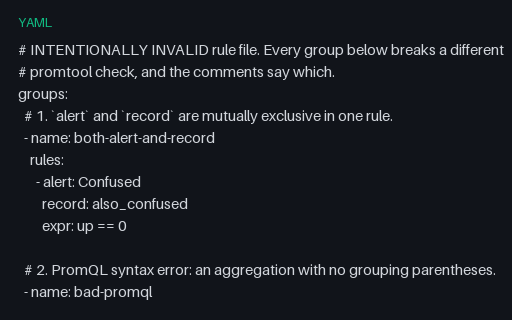
Prometheus Alerting Rules — Intentionally Invalid, Five Distinct Faults (yaml)

A rule file that is perfectly valid YAML and completely invalid as Prometheus rules: a rule that is both an alert and a recording rule, a PromQL syntax error, a duplicated group name, a rule with no expr and a duration written in prose. Intentionally invalid, with each fault labelled in place.

File
YAML · Alerts
Use case
ObservabilitySchema validation+1· Conversion set
Preview of Prometheus Exposition — 2,000-Series Cardinality Explosion (prom)
prom
299.8 KB
Actual file preview for Prometheus Exposition — 2,000-Series Cardinality Explosion (prom)

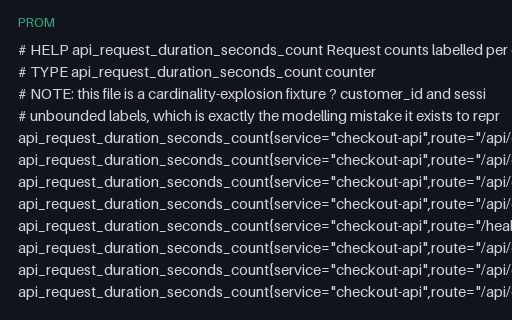
Prometheus Exposition — 2,000-Series Cardinality Explosion (prom)

A single metric family blown up to 2,000 series by two unbounded labels — customer_id and session_id — which is the most common way a metrics bill and a TSDB both fall over. A load fixture for scrape parsing and a worked example for cardinality-limit rules.

File
PROM · Metrics