Skip to content
Novus Examples

Explore the test library

Search files, editable visual templates, and live browser targets from one registry-backed directory. Filtered query views stay crawlable for links but are deliberately noindex; the stable taxonomy pages below remain the canonical search surfaces.

120 results

Page 4 of 5; 24 results per page.

Show the canonical directory
Preview of Prometheus Exposition — Broken Histograms, Intentionally Invalid (prom)
prom
594 B
Actual file preview for Prometheus Exposition — Broken Histograms, Intentionally Invalid (prom)

Prometheus Exposition — Broken Histograms, Intentionally Invalid (prom)

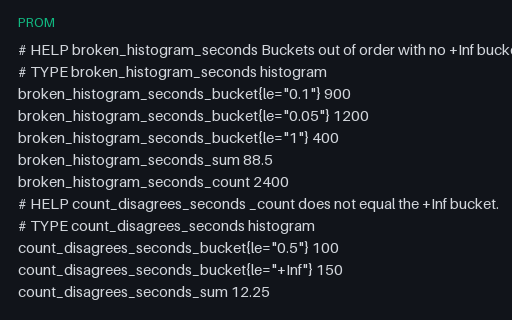
Two histogram families that are syntactically fine and semantically wrong: one has non-monotonic buckets and no +Inf bucket, the other reports a _count larger than its +Inf bucket. Intentionally invalid, because histogram_quantile over either produces a confidently wrong number rather than an error.

File
PROM · Metrics
Use case
ObservabilitySchema validation+1· Conversion set
Preview of Prometheus Exposition — Counters and Gauges (prom)
prom
2.9 KB
Actual file preview for Prometheus Exposition — Counters and Gauges (prom)

Prometheus Exposition — Counters and Gauges (prom)

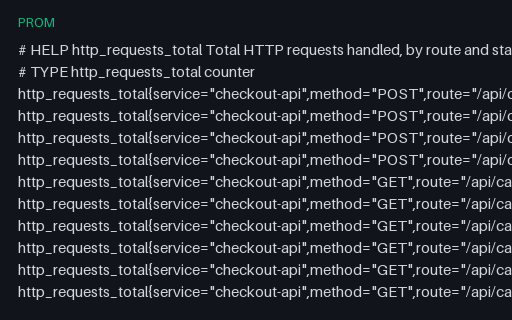
The body a /metrics endpoint returns: five metric families with HELP and TYPE metadata across 27 labelled series — request counters by route and status, process and runtime gauges, per-target up values (one deliberately 0) and a business gauge. The baseline exposition-parser fixture.

File
PROM · Metrics
Use case
ObservabilityTime-series data+1· Conversion set
Preview of Prometheus Exposition — Cumulative Histogram (prom)
prom
1.1 KB
Actual file preview for Prometheus Exposition — Cumulative Histogram (prom)

Prometheus Exposition — Cumulative Histogram (prom)

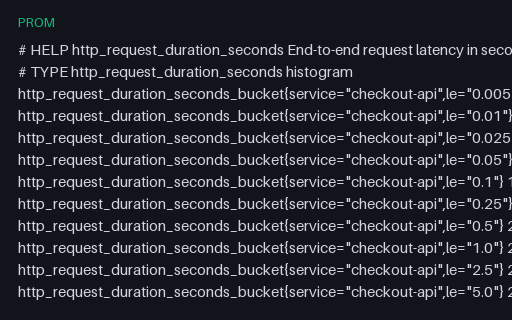
A classic Prometheus histogram: eleven finite le buckets plus +Inf, with monotonically non-decreasing cumulative counts and matching _sum and _count series. The fixture for bucket ordering, cumulative arithmetic and histogram_quantile interpolation.

File
PROM · Metrics
Use case
ObservabilityTime-series data+1· Conversion set
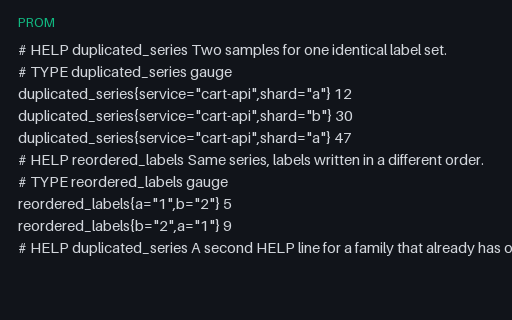
Preview of Prometheus Exposition — Duplicate Series, Intentionally Invalid (prom)
prom
497 B
Actual file preview for Prometheus Exposition — Duplicate Series, Intentionally Invalid (prom)

Prometheus Exposition — Duplicate Series, Intentionally Invalid (prom)

One label set exposed twice, a second pair that is only a duplicate once labels are sorted, and a repeated HELP line. Intentionally invalid: a scrape must fail rather than let last-write-wins decide which of two values for the same series survives.

File
PROM · Metrics
Use case
ObservabilitySchema validation+1· Conversion set
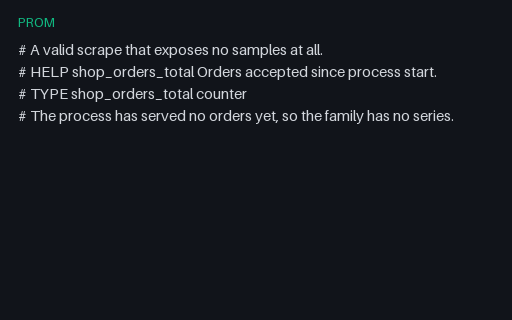
Preview of Prometheus Exposition — Empty but Valid Scrape (prom)
prom
213 B
Actual file preview for Prometheus Exposition — Empty but Valid Scrape (prom)

Prometheus Exposition — Empty but Valid Scrape (prom)

A scrape body with metadata but no samples, which is what a freshly started process returns before it has recorded anything. Valid, and routinely mistaken for a failed scrape by code that treats an empty result as an error.

File
PROM · Metrics
Use case
ObservabilityError handling+1· Conversion set
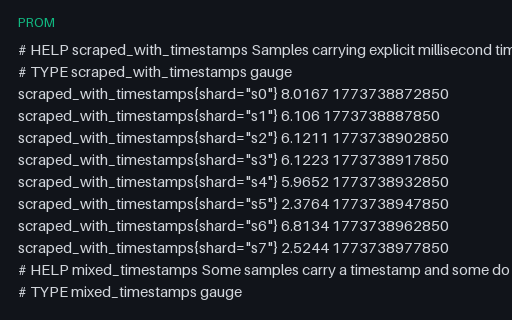
Preview of Prometheus Exposition — Explicit and Skewed Timestamps (prom)
prom
884 B
Actual file preview for Prometheus Exposition — Explicit and Skewed Timestamps (prom)

Prometheus Exposition — Explicit and Skewed Timestamps (prom)

Samples with explicit millisecond timestamps alongside samples without any, including one an hour stale and one an hour in the future. Optional timestamps are the part of the exposition format most parsers get wrong, and out-of-window samples are what a scraper must reject rather than backfill.

File
PROM · Metrics
Use case
ObservabilityTime-series data+1· Conversion set
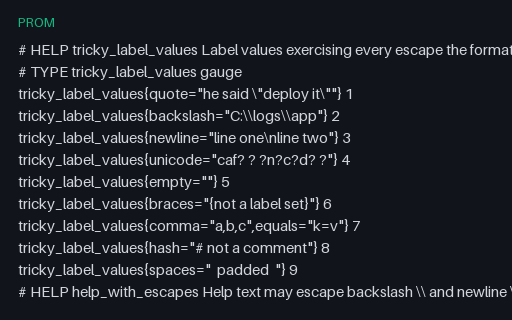
Preview of Prometheus Exposition — Label Value Escaping Edge Cases (prom)
prom
681 B
Actual file preview for Prometheus Exposition — Label Value Escaping Edge Cases (prom)

Prometheus Exposition — Label Value Escaping Edge Cases (prom)

Ten series whose label values contain the characters that break naive line splitting — escaped quotes and backslashes, an escaped newline, non-ASCII text, braces, commas, equals signs, a leading hash and significant whitespace. The exposition format defines exactly three escapes and this file uses all of them.

File
PROM · Metrics
Use case
ObservabilityEncoding detection+1· Conversion set
Preview of Prometheus Exposition — NaN, Infinities and Float Limits (prom)
prom
701 B
Actual file preview for Prometheus Exposition — NaN, Infinities and Float Limits (prom)

Prometheus Exposition — NaN, Infinities and Float Limits (prom)

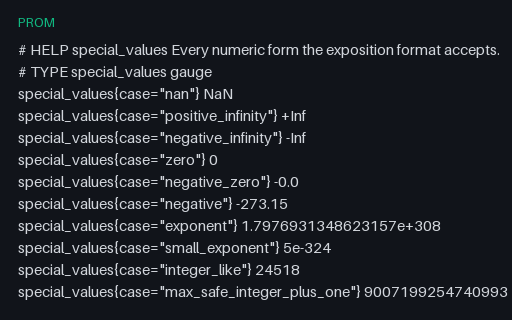
Every numeric form the exposition format permits: NaN, +Inf and -Inf, negative zero, denormal and maximum doubles, and a uint64 counter beyond the exact range of a double. Parsers that route values through a JSON number or a 32-bit float fail on this file specifically.

File
PROM · Metrics
Use case
ObservabilityTime-series data+1· Conversion set
Preview of Prometheus Exposition — Samples with No HELP or TYPE (prom)
prom
264 B
Actual file preview for Prometheus Exposition — Samples with No HELP or TYPE (prom)

Prometheus Exposition — Samples with No HELP or TYPE (prom)

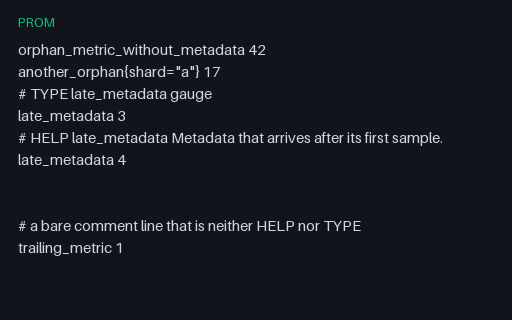
Samples exposed with no HELP or TYPE at all, metadata arriving after the sample it describes, blank and whitespace-only lines and a bare comment. All of it is legal — metadata is optional — and all of it breaks parsers that assume every sample is introduced by a TYPE line.

File
PROM · Metrics
Use case
ObservabilityConfig parsing+1· Conversion set
Preview of Prometheus Exposition — Summary with and without Quantiles (prom)
prom
700 B
Actual file preview for Prometheus Exposition — Summary with and without Quantiles (prom)

Prometheus Exposition — Summary with and without Quantiles (prom)

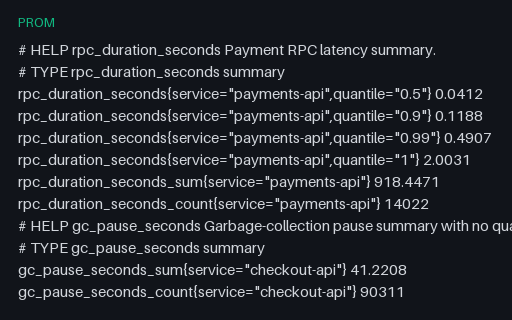
Two summary families — one exposing four client-side quantiles including quantile="1" for the observed maximum, and one exposing only _sum and _count, which is legal and common. Summaries cannot be re-aggregated across instances, and this fixture is where that gets tested.

File
PROM · Metrics
Use case
ObservabilityTime-series data+1· Conversion set
Preview of Prometheus Exposition — UTF-8 Quoted Metric and Label Names (prom)
prom
1000 B
Actual file preview for Prometheus Exposition — UTF-8 Quoted Metric and Label Names (prom)

Prometheus Exposition — UTF-8 Quoted Metric and Label Names (prom)

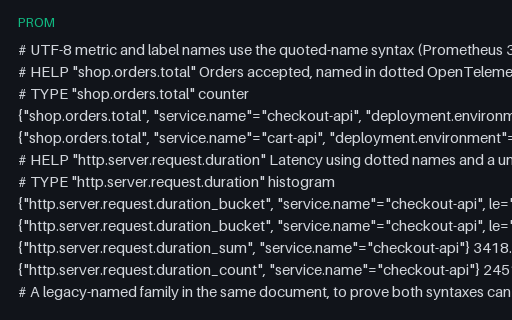
Dotted OpenTelemetry-style metric and label names written with the quoted-name syntax that Prometheus 3 accepts, mixed in one document with a legacy underscore-named family. The fixture for parsers that still assume every name matches [a-zA-Z_][a-zA-Z0-9_]*.

File
PROM · Metrics
Use case
ObservabilityEncoding detection+1· Conversion set
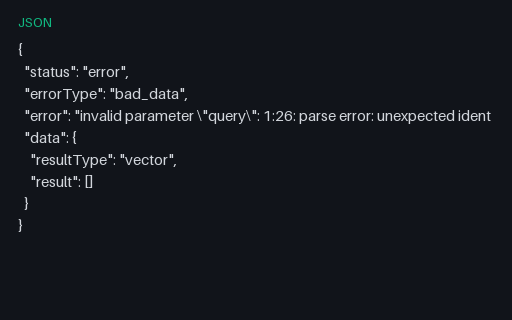
Preview of Prometheus HTTP API — Error Envelope with a PromQL Parse Error (json)
json
246 B
Actual file preview for Prometheus HTTP API — Error Envelope with a PromQL Parse Error (json)

Prometheus HTTP API — Error Envelope with a PromQL Parse Error (json)

The error envelope a Prometheus API returns for a malformed PromQL query — status, errorType, a message with a line and column position, and an empty but present data object. Clients that only check for a data key render this as a successful empty result.

File
JSON · Metrics
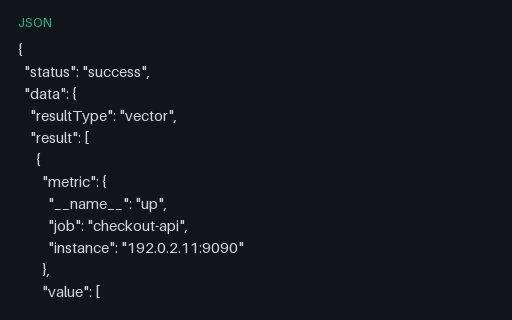
Preview of Prometheus HTTP API — Instant Query Vector with Warnings (json)
json
1.2 KB
Actual file preview for Prometheus HTTP API — Instant Query Vector with Warnings (json)

Prometheus HTTP API — Instant Query Vector with Warnings (json)

An instant-query response: five up series at a single evaluation timestamp, one of them zero, plus a warnings array that clients routinely ignore. A successful response can carry warnings, and dropping them hides truncated results.

File
JSON · Metrics
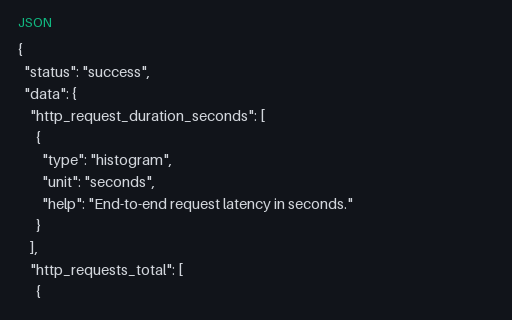
Preview of Prometheus HTTP API — Metric Metadata with a HELP Conflict (json)
json
636 B
Actual file preview for Prometheus HTTP API — Metric Metadata with a HELP Conflict (json)

Prometheus HTTP API — Metric Metadata with a HELP Conflict (json)

The metadata endpoint's response, where each metric name maps to a list because different targets can disagree. http_requests_total here has two conflicting HELP strings — the real-world state that a metric catalogue or documentation generator has to resolve rather than assume away.

File
JSON · Metrics
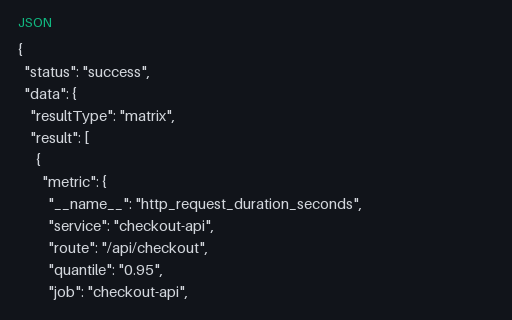
Preview of Prometheus HTTP API — query_range Matrix Response (json)
json
7.3 KB
Actual file preview for Prometheus HTTP API — query_range Matrix Response (json)

Prometheus HTTP API — query_range Matrix Response (json)

A Prometheus /api/v1/query_range response: three labelled series of 30 points each at a 60-second step, with sample values as JSON strings and timestamps as float seconds. The exact envelope a dashboard client has to unpack, including the string-typed values that break naive charting code.

File
JSON · Metrics
Use case
ObservabilityJSON parsing+1· Conversion set
Preview of Prometheus Recording Rules — Layered Pre-Aggregations (yaml)
yaml
952 B
Actual file preview for Prometheus Recording Rules — Layered Pre-Aggregations (yaml)

Prometheus Recording Rules — Layered Pre-Aggregations (yaml)

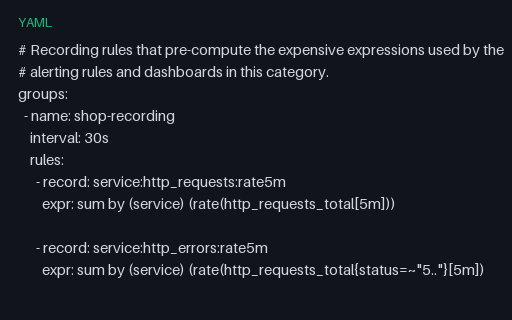
Five recording rules following the level:metric:operation naming convention, where one rule consumes two others recorded earlier in the same group — evaluation order inside a group is sequential, which is exactly what makes that legal and what a rule validator must understand.

File
YAML · Alerts
Use case
ObservabilityConfig parsing+1· Conversion set
Preview of Prometheus Scrape Config — Relabelling and Federation (yaml)
yaml
1.4 KB
Actual file preview for Prometheus Scrape Config — Relabelling and Federation (yaml)

Prometheus Scrape Config — Relabelling and Federation (yaml)

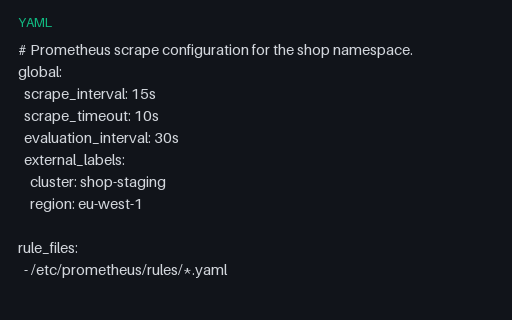
Three scrape jobs with the parts that actually matter: relabel_configs rewriting a target label with a capture group, metric_relabel_configs dropping the two unbounded labels from the cardinality fixture, honor_timestamps for the textfile collector and a federation job with a match[] selector.

File
YAML · Alerts
Preview of Prometheus Textfile Collector — Batch Job Metrics (prom)
prom
793 B
Actual file preview for Prometheus Textfile Collector — Batch Job Metrics (prom)

Prometheus Textfile Collector — Batch Job Metrics (prom)

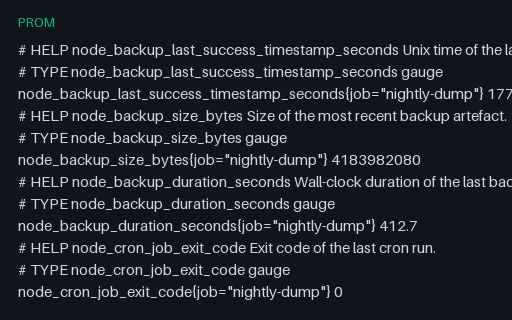
The file a cron job drops into the node_exporter textfile directory so a batch task can be monitored without a scrape endpoint: last-success timestamp, artefact size, duration and per-job exit codes, one of which is non-zero. The canonical shape for batch-job alerting.

File
PROM · Metrics
Use case
ObservabilityTime-series data+1· Conversion set
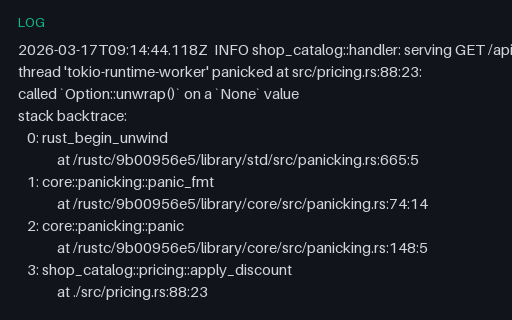
Preview of Rust Panic with Numbered Backtrace (log)
log
974 B
Actual file preview for Rust Panic with Numbered Backtrace (log)

Rust Panic with Numbered Backtrace (log)

A Rust panic surrounded by ordinary tracing output: the panic location with line and column, a six-frame numbered backtrace where every frame spans two lines, and the RUST_BACKTRACE note. Frame numbering and the deep indent are what a generic stack parser gets wrong here.

File
LOG · Logs · 6 frames
Use case
ObservabilityLog parsing+1· Conversion set
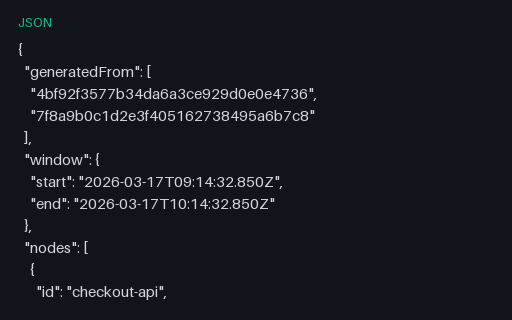
Preview of Service Dependency Graph — Derived from the Trace Set (json)
json
1.9 KB
Actual file preview for Service Dependency Graph — Derived from the Trace Set (json)

Service Dependency Graph — Derived from the Trace Set (json)

The service map you get by aggregating the trace fixtures in this category — five service nodes and the edges between them with call counts and latency percentiles, including the messaging edge that exists only because of a span link. Ground truth for a service-graph processor.

File
JSON · Traces
Preview of Service Level Objectives — Two SLOs in One Multi-Document YAML (yaml)
yaml
1.8 KB
Actual file preview for Service Level Objectives — Two SLOs in One Multi-Document YAML (yaml)

Service Level Objectives — Two SLOs in One Multi-Document YAML (yaml)

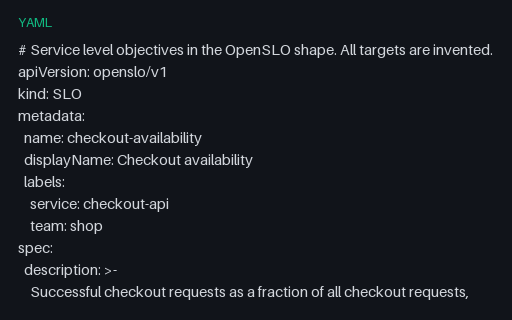
Two SLOs — availability and latency — in one multi-document YAML separated by ---, each defined as a ratio of good events to total over a rolling 28-day window. The latency SLO measures the le="1" bucket against the count, which is the correct way to do it from a histogram.

File
YAML · Alerts
Use case
ObservabilityConfig parsing+1· Conversion set
Preview of SLO Error Budget — 28-Day Burndown Export (csv)
csv
2.2 KB
Actual file preview for SLO Error Budget — 28-Day Burndown Export (csv)

SLO Error Budget — 28-Day Burndown Export (csv)

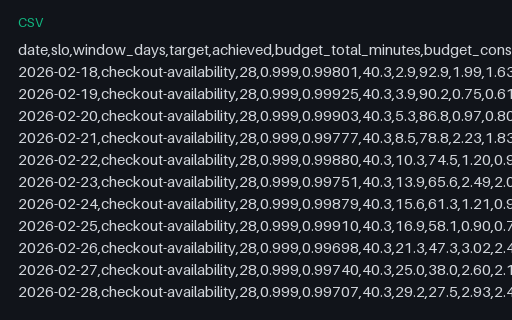
A day-by-day burndown of the availability SLO defined in the OpenSLO fixture: achieved ratio, budget consumed and remaining, and one-hour and six-hour burn rates. Consumption is monotonic across the window, which is the invariant a burn-rate chart must not violate.

File
CSV · Alerts · 28 rows
Use case
ObservabilityCSV parsing+1· Conversion set
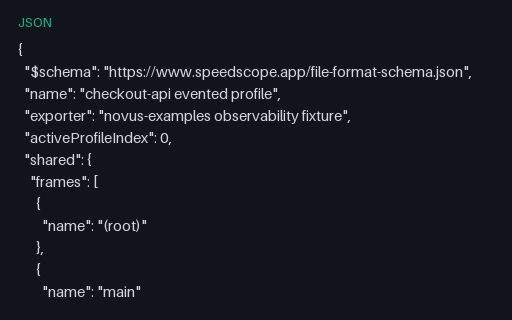
Preview of Speedscope — Evented Profile with Open and Close Events (json)
json
1.8 KB
Actual file preview for Speedscope — Evented Profile with Open and Close Events (json)

Speedscope — Evented Profile with Open and Close Events (json)

The evented half of the speedscope format — explicit O and C events that must nest like brackets, rather than sampled stacks. Tracing profilers emit this shape, and an unbalanced or out-of-order close is the corruption a loader has to detect.

File
JSON · Profiles
Use case
ObservabilityJSON parsing+1· Conversion set
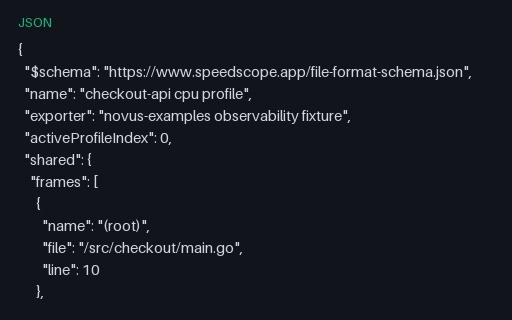
Preview of Speedscope — Sampled Profile with a Shared Frame Table (json)
json
2.2 KB
Actual file preview for Speedscope — Sampled Profile with a Shared Frame Table (json)

Speedscope — Sampled Profile with a Shared Frame Table (json)

A speedscope sampled profile: one shared frame table with source locations, then stacks expressed as arrays of frame indices with per-sample weights in nanoseconds. The index indirection is the whole design, and resolving it wrong produces a plausible but wrong flamegraph.

File
JSON · Profiles · 9 frames
Use case
ObservabilityJSON parsing+1· Conversion set