Skip to content
Novus Examples

Explore the test library

Search files, editable visual templates, and live browser targets from one registry-backed directory. Filtered query views stay crawlable for links but are deliberately noindex; the stable taxonomy pages below remain the canonical search surfaces.

120 results

Page 2 of 5; 24 results per page.

Show the canonical directory
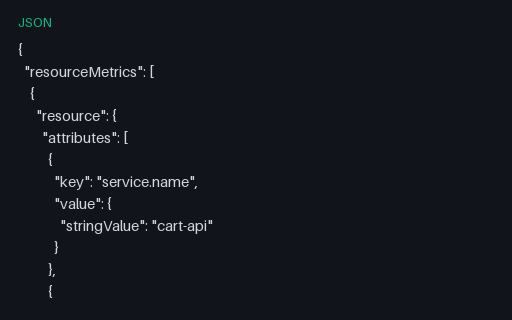
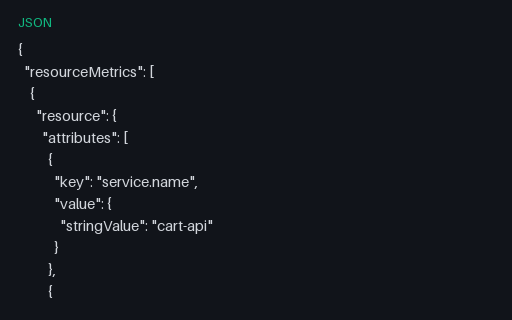
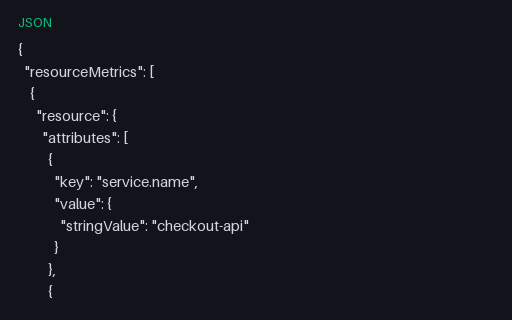
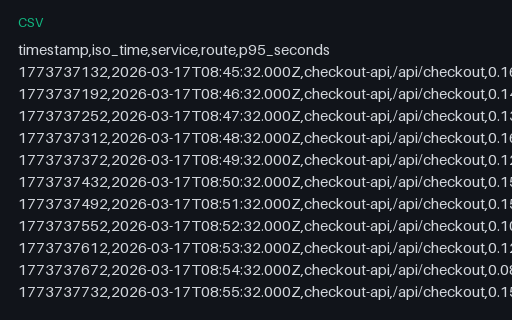
Preview of Metric Range Export — Long (Tidy) CSV (csv)
csv
6.1 KB
Actual file preview for Metric Range Export — Long (Tidy) CSV (csv)

Metric Range Export — Long (Tidy) CSV (csv)

The same 90 samples as the query_range response, exported one row per observation with both epoch and ISO 8601 timestamps. The long layout every dataframe library prefers, and half of a reshaping pair.

File
CSV · Metrics · 90 rows
Use case
ObservabilityCSV parsing+1· Conversion set
Preview of Metric Range Export — Wide (Pivoted) CSV (csv)
csv
1.9 KB
Actual file preview for Metric Range Export — Wide (Pivoted) CSV (csv)

Metric Range Export — Wide (Pivoted) CSV (csv)

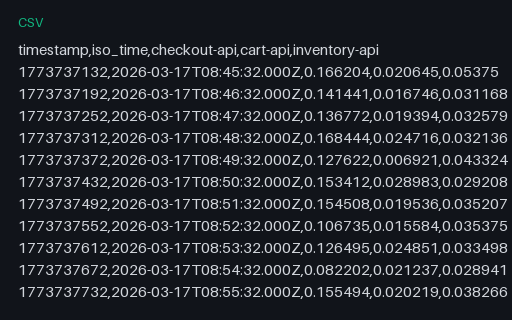
The same 90 samples pivoted to one column per service and one row per timestamp — the layout a spreadsheet chart expects. Paired with the long-format export so a reshape can be scored in both directions.

File
CSV · Metrics · 30 rows
Use case
ObservabilityCSV parsing+1· Conversion set
Preview of OpenMetrics — Full Document with UNIT, info and stateset (prom)
prom
2.1 KB
Actual file preview for OpenMetrics — Full Document with UNIT, info and stateset (prom)

OpenMetrics — Full Document with UNIT, info and stateset (prom)

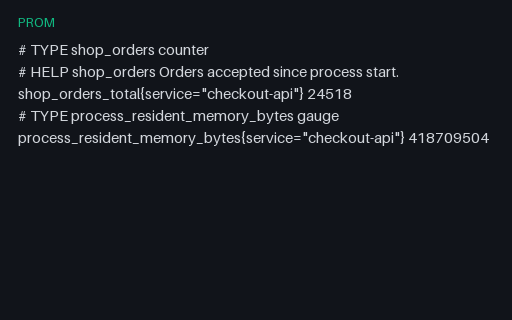
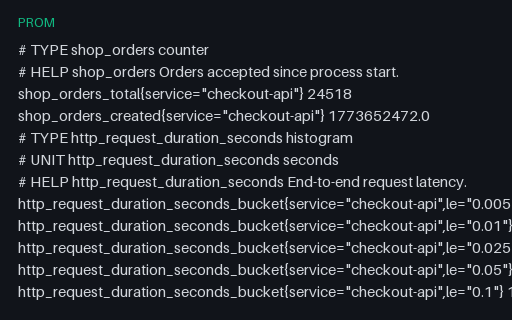
A complete OpenMetrics document — the _total and _created series a counter really has, UNIT metadata, an info metric carrying build metadata and a stateset with exactly one active state — terminated by the mandatory # EOF. This is what the exposition format became once it was standardised.

File
PROM · Metrics
Use case
ObservabilityTime-series data+1· Conversion set
Preview of OpenMetrics — Histogram Exemplars Linking to the Trace Fixtures (prom)
prom
1.7 KB
Actual file preview for OpenMetrics — Histogram Exemplars Linking to the Trace Fixtures (prom)

OpenMetrics — Histogram Exemplars Linking to the Trace Fixtures (prom)

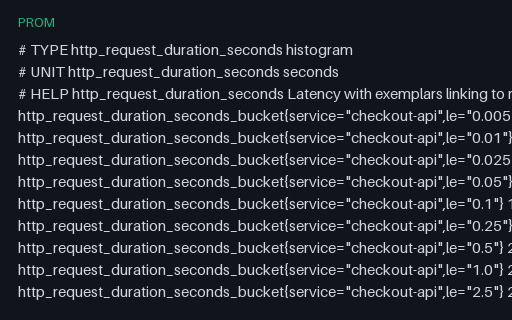
Histogram buckets carrying exemplars whose trace_id and span_id resolve against the OTLP trace fixtures in this category — the exact-to-example link that turns a latency spike on a graph into a specific request. Five exemplars, each with its own observed value and timestamp.

File
PROM · Metrics
Use case
ObservabilityTime-series data+1· Conversion set
Preview of OpenMetrics — Missing # EOF Marker, Intentionally Invalid (prom)
prom
238 B
Actual file preview for OpenMetrics — Missing # EOF Marker, Intentionally Invalid (prom)

OpenMetrics — Missing # EOF Marker, Intentionally Invalid (prom)

A document that parses perfectly as Prometheus text and is invalid as OpenMetrics, because the mandatory # EOF terminator is missing. That marker is the format's only defence against a truncated response being accepted as complete — which is the exact failure this file reproduces.

File
PROM · Metrics
Use case
ObservabilitySchema validation+1· Conversion set
Preview of OpenTelemetry Collector — Tail-Sampling Policies (yaml)
yaml
1.9 KB
Actual file preview for OpenTelemetry Collector — Tail-Sampling Policies (yaml)

OpenTelemetry Collector — Tail-Sampling Policies (yaml)

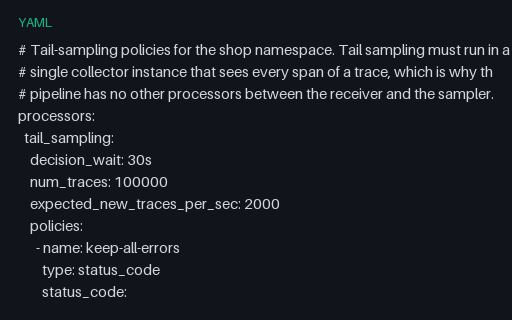
Six tail-sampling policies including an inverted regex match that drops health checks and a composite policy with its own rate limit and ordered sub-policies. Policies are OR-ed and one match keeps the entire trace, which is the semantic most people get backwards.

File
YAML · Alerts
Use case
ObservabilityConfig parsing+1· Conversion set
Preview of OpenTelemetry Collector — Three-Signal Pipeline Configuration (yaml)
yaml
2.4 KB
Actual file preview for OpenTelemetry Collector — Three-Signal Pipeline Configuration (yaml)

OpenTelemetry Collector — Three-Signal Pipeline Configuration (yaml)

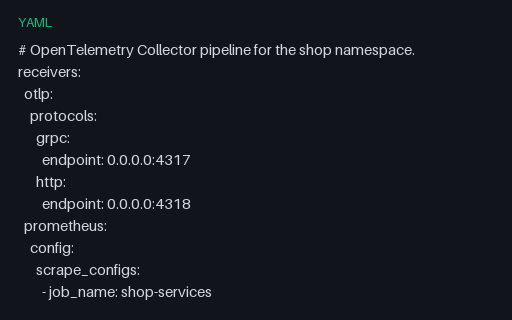
A Collector configuration wiring traces, metrics and logs through separate pipelines, with named component instances, a filelog receiver that parses the CRI log fixture, OTTL statements performing the semantic-convention migration from the paired trace fixtures, and a redaction processor.

File
YAML · Alerts
Use case
ObservabilityConfig parsing+1· Conversion set
Preview of OTLP Logs — Export Document with Severity and Trace Correlation (json)
json
8.9 KB
Actual file preview for OTLP Logs — Export Document with Severity and Trace Correlation (json)

OTLP Logs — Export Document with Severity and Trace Correlation (json)

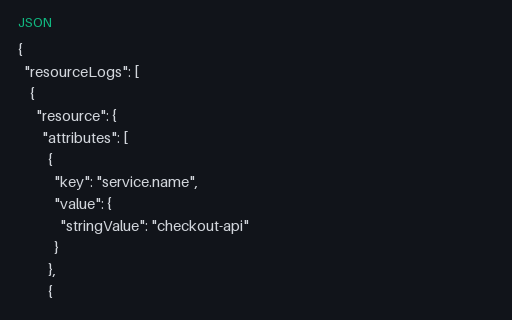
An OTLP logs export across two resources: five records spanning DEBUG to FATAL with both severityNumber and severityText, separate event and observed timestamps, trace and span correlation, and one record whose body is a full multi-line Python traceback.

File
JSON · Logs
Use case
ObservabilityJSON parsing+1· Conversion set
Preview of OTLP Logs — NDJSON Stream, One Record per Line (jsonl)
jsonl
7.2 KB
Actual file preview for OTLP Logs — NDJSON Stream, One Record per Line (jsonl)

OTLP Logs — NDJSON Stream, One Record per Line (jsonl)

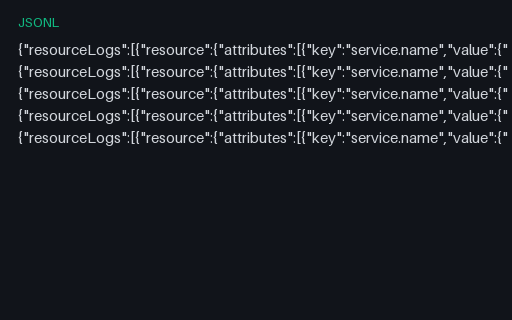
The same five OTLP log records reframed as one self-contained export per line, with the resource attributes repeated on every line. The trade a line-oriented sink makes: each line stands alone, at the cost of repeating the resource block five times.

File
JSONL · Logs
Use case
ObservabilityJSON parsing+1· Conversion set
Preview of OTLP Metrics — Base-2 Exponential Histogram (json)
json
4 KB
Actual file preview for OTLP Metrics — Base-2 Exponential Histogram (json)

OTLP Metrics — Base-2 Exponential Histogram (json)

An exponential histogram at scale 3 — eight buckets per power of two — with a negative offset, a zero bucket and its threshold. Bucket i covers (base^(offset+i), base^(offset+i+1)], and getting that indexing wrong silently shifts every percentile, which is what this fixture is for.

File
JSON · Metrics
Use case
ObservabilityJSON parsing+1· Conversion set
Preview of OTLP Metrics — Counter Reset on Process Restart (json)
json
5.3 KB
Actual file preview for OTLP Metrics — Counter Reset on Process Restart (json)

OTLP Metrics — Counter Reset on Process Restart (json)

A monotonic counter that drops from 94,880 to 1,120 when its process restarts, with startTimeUnixNano changing at exactly that point to mark the reset. Rate calculations that subtract consecutive values without checking the start timestamp produce a large negative rate here.

File
JSON · Metrics
Use case
ObservabilityTime-series data+1· Conversion set
Preview of OTLP Metrics — Cumulative Temporality (json)
json
3.5 KB
Actual file preview for OTLP Metrics — Cumulative Temporality (json)

OTLP Metrics — Cumulative Temporality (json)

Cumulative sums whose start timestamp stays fixed across exports, so every point is the running total since process start. Paired with a delta-temporality twin covering the same window, because converting between the two is a stateful operation that a bridge must get right in both directions.

File
JSON · Metrics
Use case
ObservabilityTime-series data+1· Paired fixture
Preview of OTLP Metrics — Delta Temporality (json)
json
5.3 KB
Actual file preview for OTLP Metrics — Delta Temporality (json)

OTLP Metrics — Delta Temporality (json)

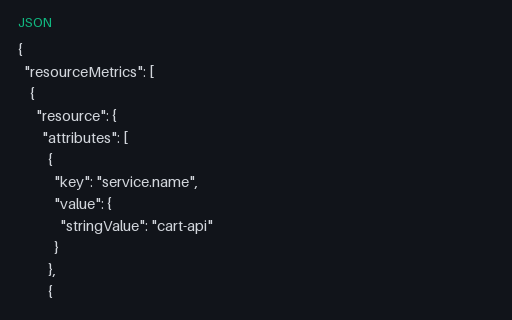
The same 24 hours of cart updates as six delta points, each with its own start and end timestamp covering a four-hour window. The delta twin of the cumulative fixture: summing these must reproduce the cumulative total exactly, and a gap or overlap in the windows is the failure to catch.

File
JSON · Metrics
Use case
ObservabilityTime-series data+1· Paired fixture
Preview of OTLP Metrics — Exemplars with Trace and Span IDs (json)
json
4.8 KB
Actual file preview for OTLP Metrics — Exemplars with Trace and Span IDs (json)

OTLP Metrics — Exemplars with Trace and Span IDs (json)

An OTLP histogram carrying two exemplars, each with the trace and span ID of a request that landed in that bucket — including the 2.0031-second outlier that corresponds to the failed payment in the error-trace fixture. The metrics-to-traces jump, with a resolvable target.

File
JSON · Metrics
Use case
ObservabilityJSON parsing+1· Conversion set
Preview of OTLP Metrics — Explicit-Bucket Histogram (json)
json
3.9 KB
Actual file preview for OTLP Metrics — Explicit-Bucket Histogram (json)

OTLP Metrics — Explicit-Bucket Histogram (json)

An OTLP explicit-bucket histogram over the same latency distribution as the Prometheus fixture — but with per-bucket counts rather than cumulative ones, and one more bucket count than bounds. Converting between the two is where most OTLP-to-Prometheus bridges get the arithmetic wrong.

File
JSON · Metrics
Use case
ObservabilityJSON parsing+1· Conversion set
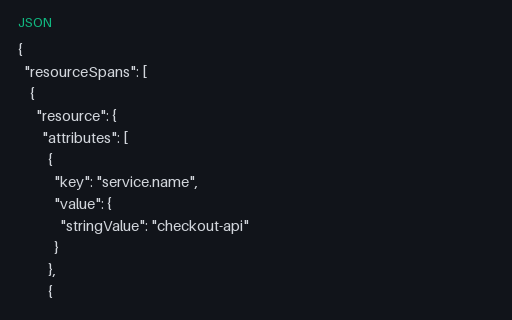
Preview of OTLP Metrics — Monotonic Sum and Gauge Data Points (json)
json
6.6 KB
Actual file preview for OTLP Metrics — Monotonic Sum and Gauge Data Points (json)

OTLP Metrics — Monotonic Sum and Gauge Data Points (json)

An OTLP metrics export with a monotonic cumulative sum and two gauges, showing the parts of the wire format that trip parsers: int data points serialised as JSON strings, UCUM unit annotations like {request} and By, and the start timestamp that makes a counter reset detectable.

File
JSON · Metrics
Use case
ObservabilityJSON parsing+1· Conversion set
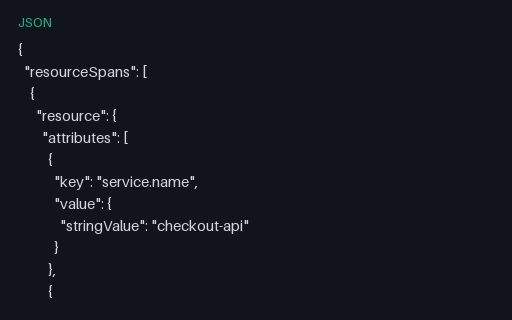
Preview of OTLP Metrics — Summary with Client-Side Quantiles (json)
json
3.5 KB
Actual file preview for OTLP Metrics — Summary with Client-Side Quantiles (json)

OTLP Metrics — Summary with Client-Side Quantiles (json)

The OTLP summary type — quantiles computed on the client, kept only for translating legacy Prometheus summaries. It carries the same four quantiles as the Prometheus summary fixture, and like that one it cannot be re-aggregated across instances without producing a wrong number.

File
JSON · Metrics
Use case
ObservabilityJSON parsing+1· Conversion set
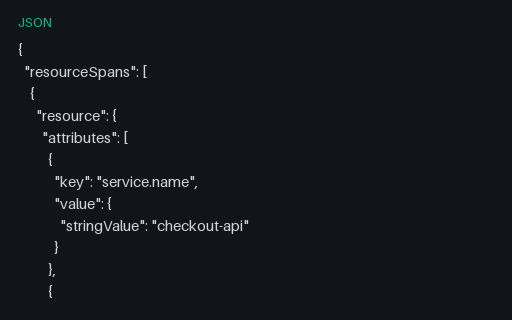
Preview of OTLP Trace — 48-Span Linear Chain (json)
json
38.1 KB
Actual file preview for OTLP Trace — 48-Span Linear Chain (json)

OTLP Trace — 48-Span Linear Chain (json)

A single-service trace 48 levels deep — a recursive GraphQL-style resolver where every span is the child of the one before it. A depth fixture for waterfall renderers, tree-layout code and any parser that recurses over parentage.

File
JSON · Traces
Use case
ObservabilityJSON parsing+1· Conversion set

Preview of OTLP Trace — 60-Way Parallel Fan-Out (json)
json
51.1 KB
Actual file preview for OTLP Trace — 60-Way Parallel Fan-Out (json)

OTLP Trace — 60-Way Parallel Fan-Out (json)

One root span with 60 overlapping children — a scatter-gather query across database shards. The counterpart to the deep-chain fixture: shallow but very wide, which is what breaks waterfall layouts that assume spans do not overlap in time.

File
JSON · Traces
Use case
ObservabilityJSON parsing+1· Conversion set
Preview of OTLP Trace — All-Zero Trace and Span IDs, Intentionally Invalid (json)
json
6.2 KB
Actual file preview for OTLP Trace — All-Zero Trace and Span IDs, Intentionally Invalid (json)

OTLP Trace — All-Zero Trace and Span IDs, Intentionally Invalid (json)

A trace whose trace ID and root span ID are all zeroes — the value an uninitialised context produces. Intentionally invalid: the specification defines all-zero IDs as invalid, so a conformant receiver must reject the spans instead of creating a permanent bucket that every broken service writes into.

File
JSON · Traces
Use case
ObservabilitySchema validation+1· Conversion set
Preview of OTLP Trace — AnyValue Attribute Type Matrix (json)
json
6.8 KB
Actual file preview for OTLP Trace — AnyValue Attribute Type Matrix (json)

OTLP Trace — AnyValue Attribute Type Matrix (json)

One span carrying every OTLP AnyValue kind — string (plain, Unicode, multi-line, empty), int64 encoded as a JSON string, double, bool, array, nested kvlist and base64 bytes. Includes an integer above 2^53 to catch decoders that route int64 through a JavaScript number.

File
JSON · Traces
Preview of OTLP Trace — Clock Skew, Child Starts Before Its Parent (json)
json
13.7 KB
Actual file preview for OTLP Trace — Clock Skew, Child Starts Before Its Parent (json)

OTLP Trace — Clock Skew, Child Starts Before Its Parent (json)

Two hosts whose clocks disagree by 12 ms, so a server span appears to start before the client span that called it. Nothing in the payload is malformed — this is the most common real cause of a negative-latency gap in a waterfall, and viewers must show it rather than crash or silently reorder.

File
JSON · Traces
Use case
ObservabilityError handling+1· Conversion set
Preview of OTLP Trace — Duplicate Span IDs, Intentionally Invalid (json)
json
19 KB
Actual file preview for OTLP Trace — Duplicate Span IDs, Intentionally Invalid (json)

OTLP Trace — Duplicate Span IDs, Intentionally Invalid (json)

Two different spans share one span ID inside a single trace, which the specification forbids. Intentionally invalid: it is the fixture for the de-duplication path, where a naive store silently overwrites one span with the other and loses a subtree.

File
JSON · Traces
Use case
ObservabilityError handling+1· Conversion set
Preview of OTLP Trace — Empty but Valid Batch (json)
json
26 B
Actual file preview for OTLP Trace — Empty but Valid Batch (json)

OTLP Trace — Empty but Valid Batch (json)

A structurally valid OTLP export containing no spans at all — what an exporter sends when every span in the interval was sampled out. The empty-input case that ingestion code routinely mistakes for an error.

File
JSON · Traces