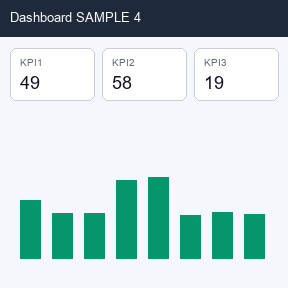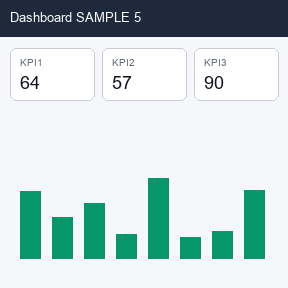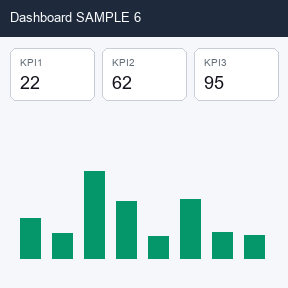
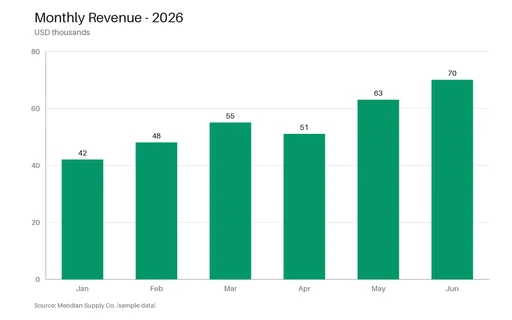
Bar Chart (PNG)
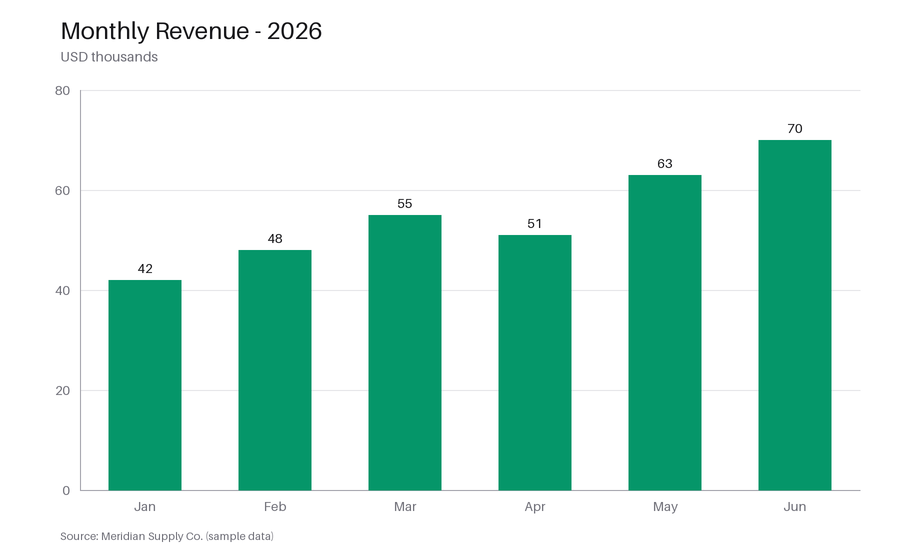
A clean bar chart of monthly revenue with axis labels, gridlines, and value labels — a real-world fixture for testing chart-extraction and OCR tools, vision models, and thumbnail rendering.
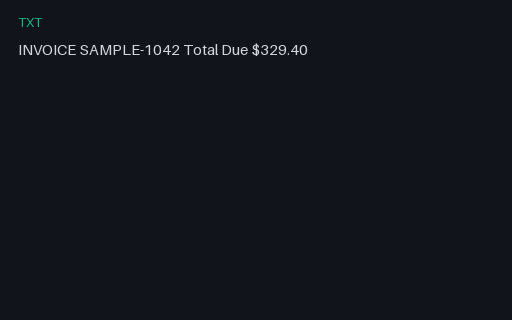
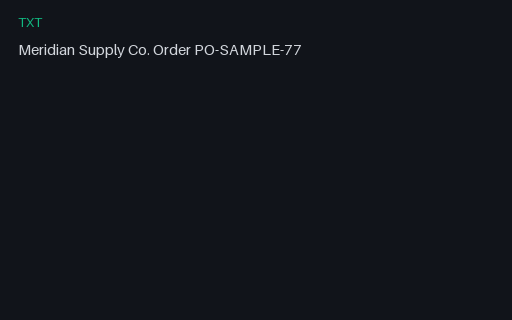
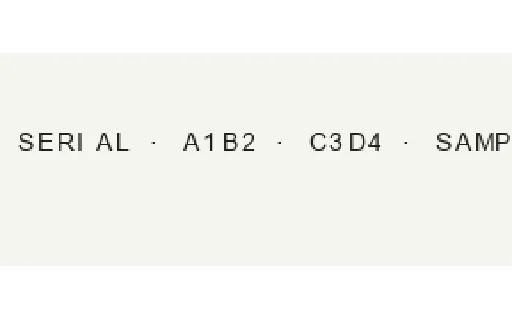
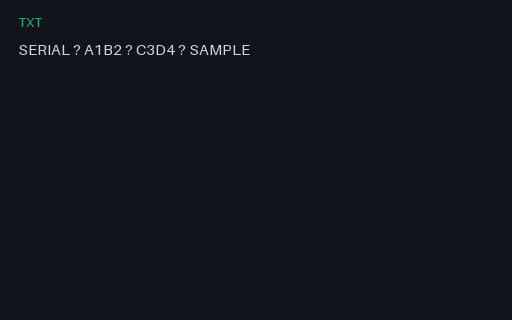
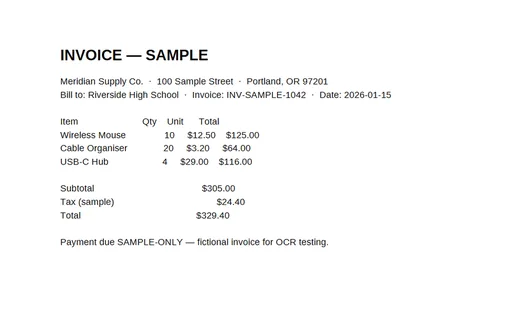
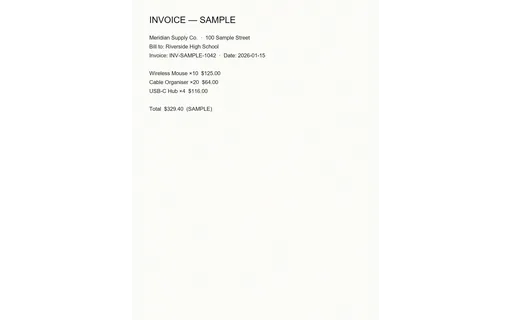
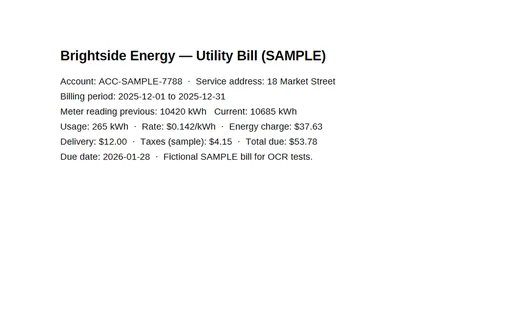
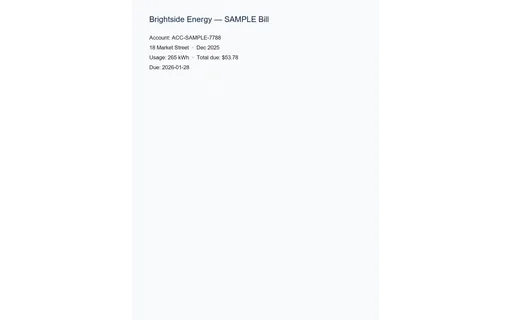
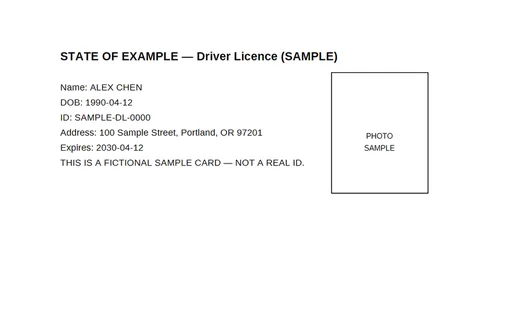
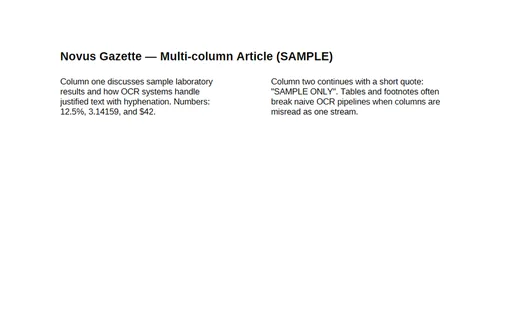
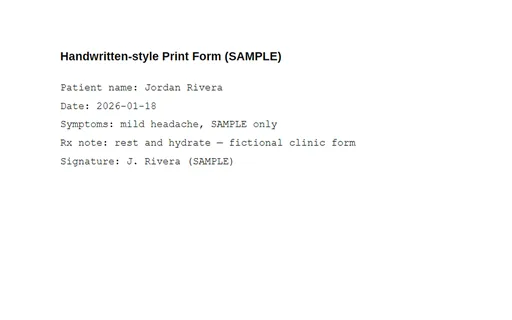
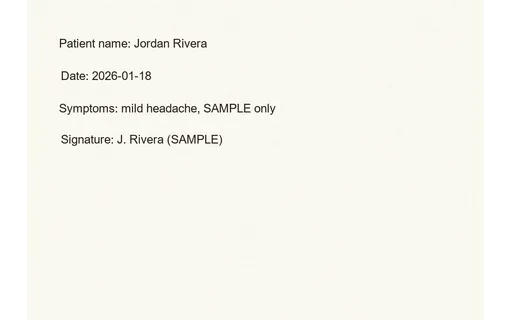
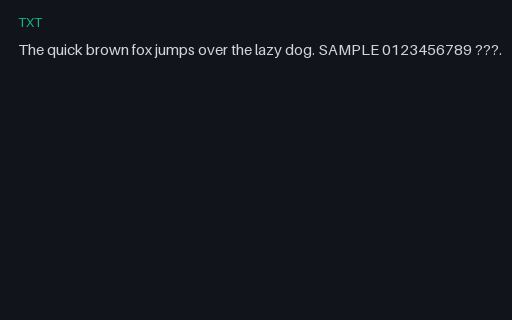
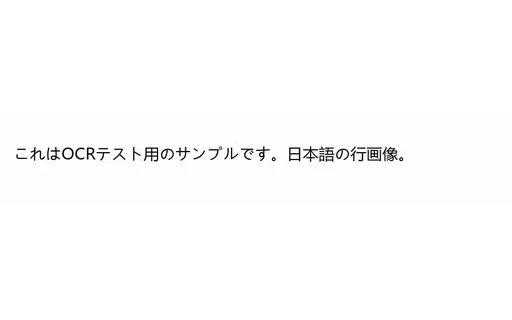
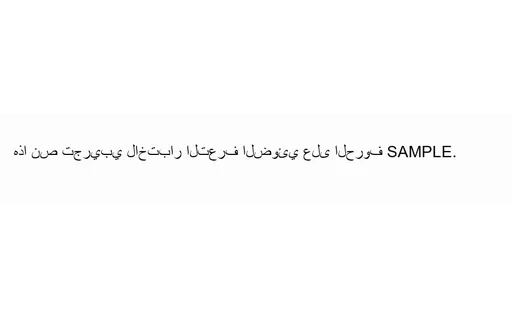
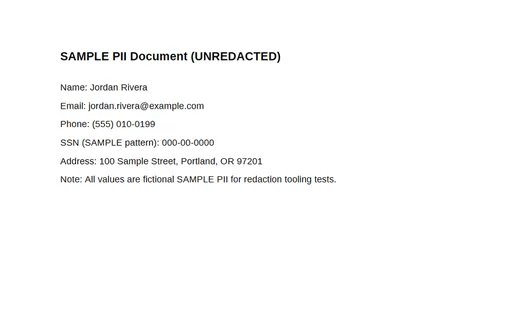
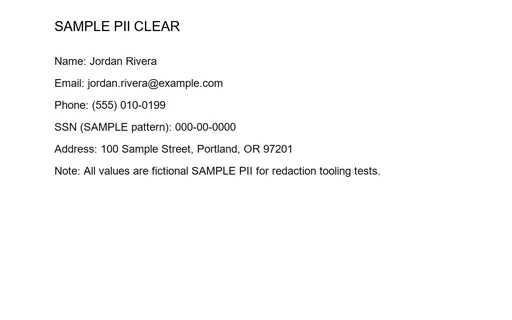
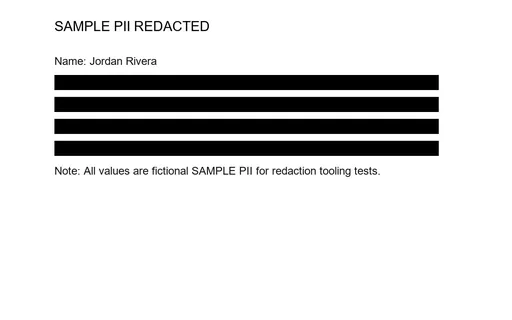
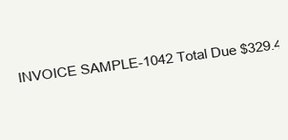
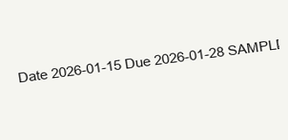
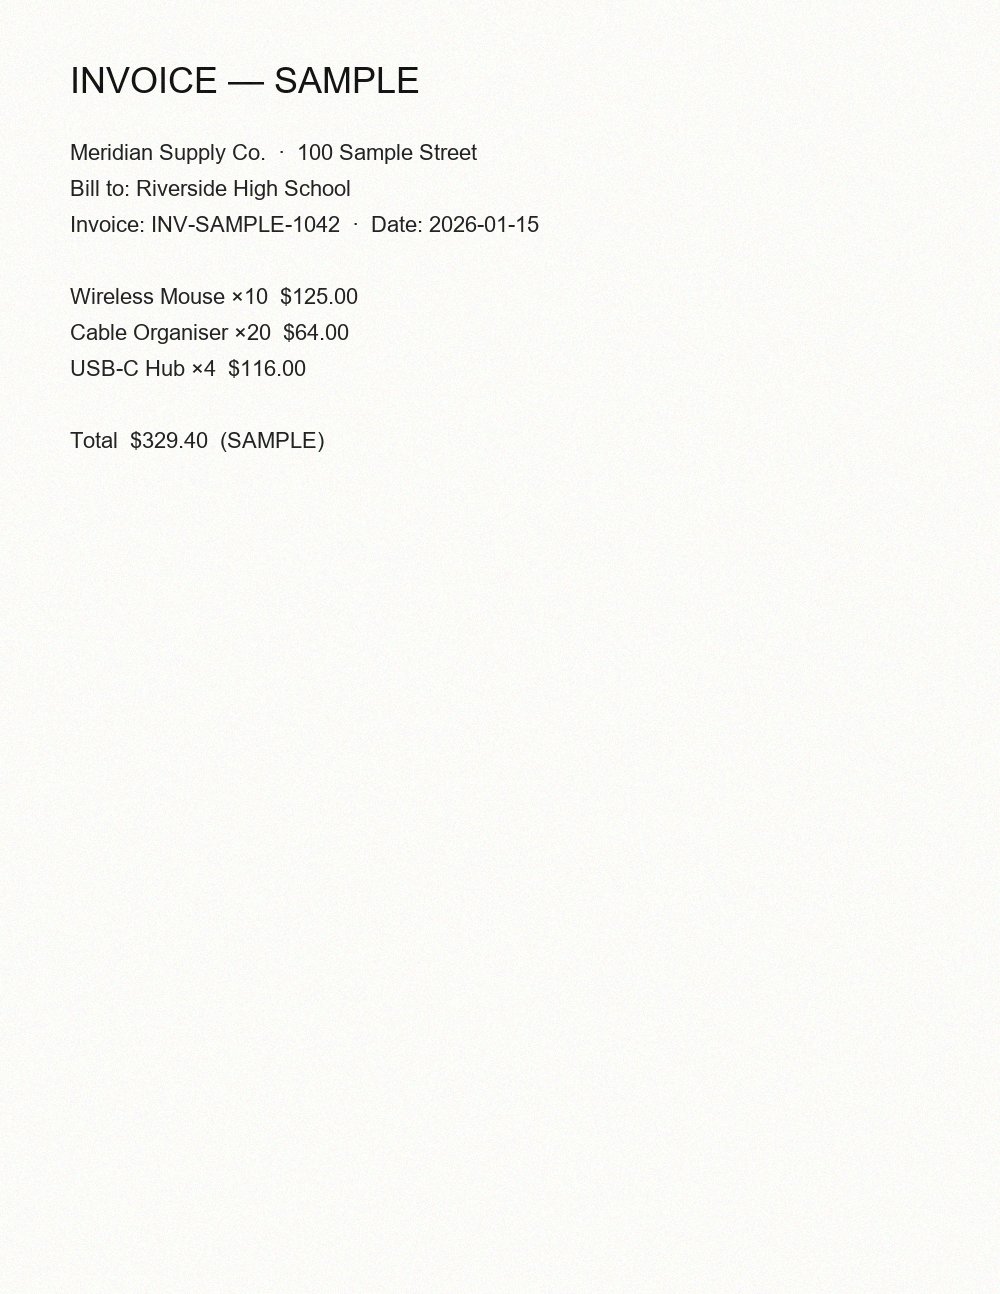
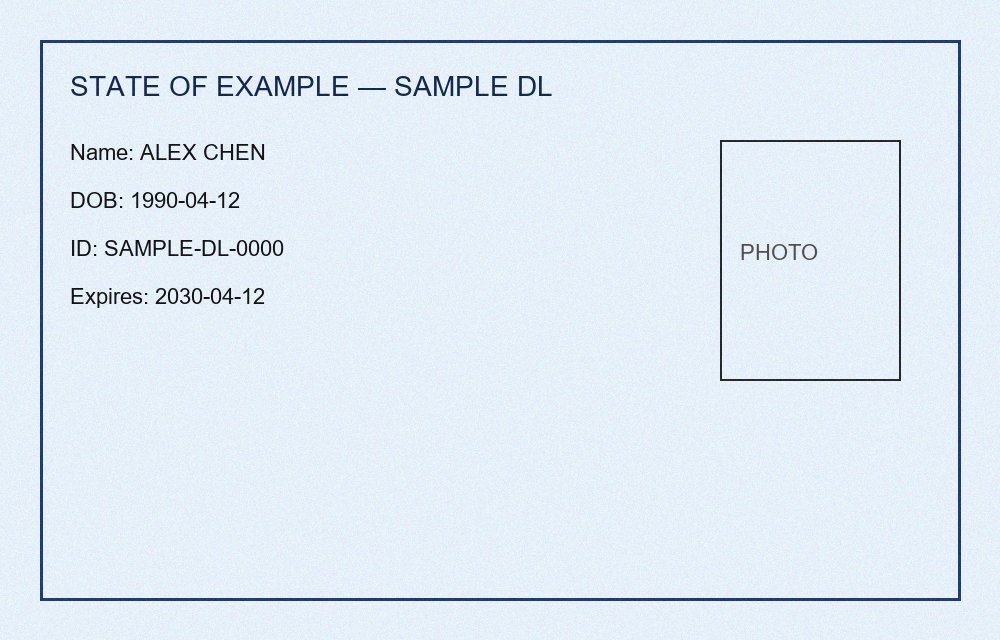
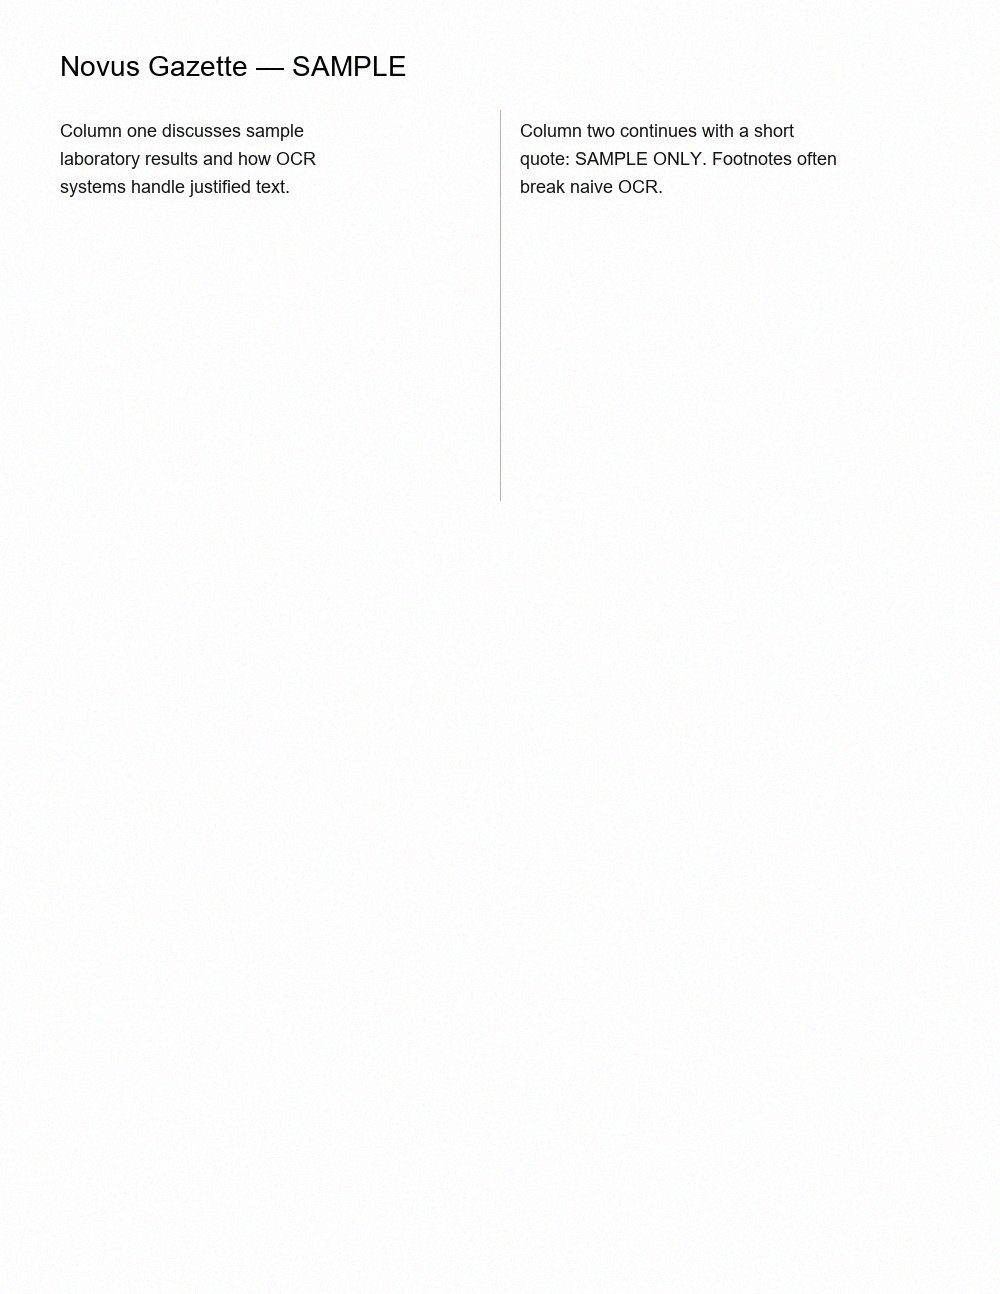
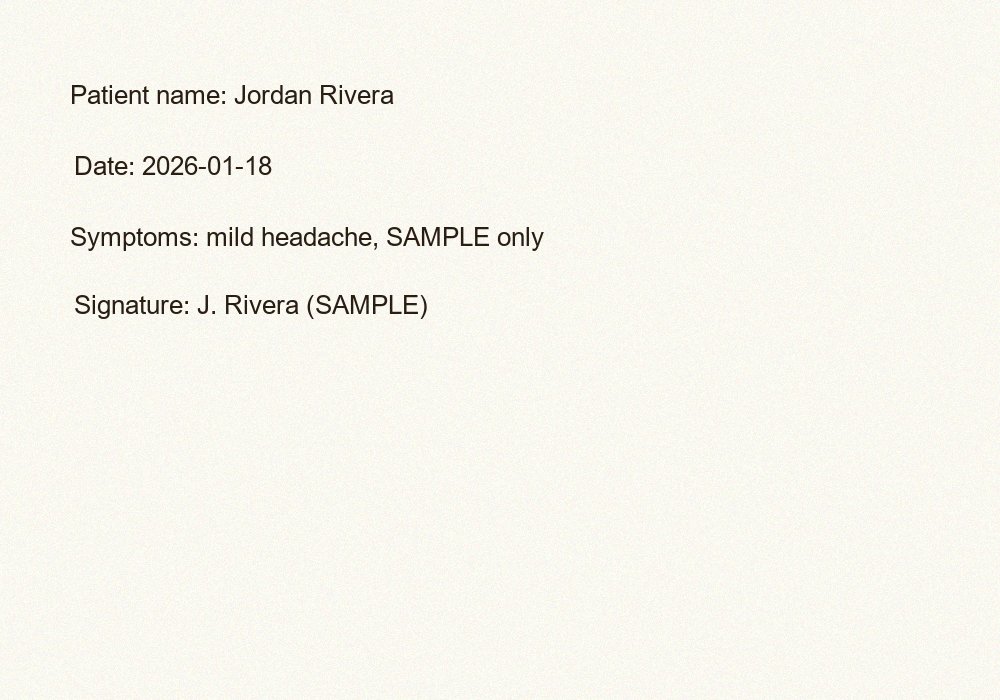
Image-only 'scanned' documents paired with their text source, for measuring OCR accuracy against a known ground truth.
A clean bar chart of monthly revenue with axis labels, gridlines, and value labels — a real-world fixture for testing chart-extraction and OCR tools, vision models, and thumbnail rendering.
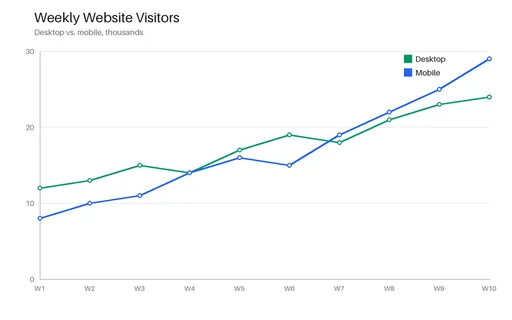
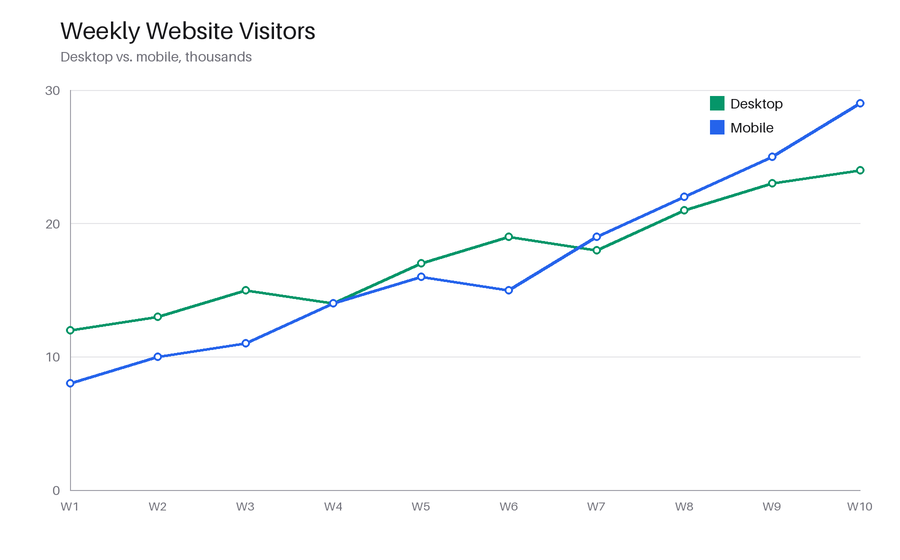
A two-series line chart (desktop vs. mobile visitors) with markers, a legend, and gridlines — for testing chart parsing, trend extraction, and image pipelines against a known plot.
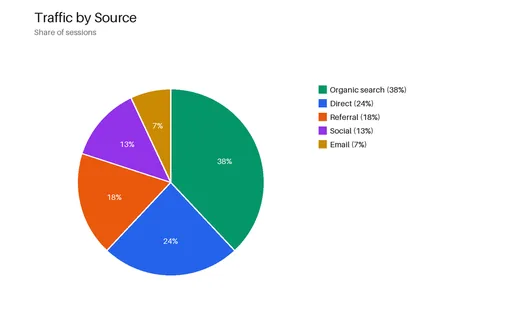
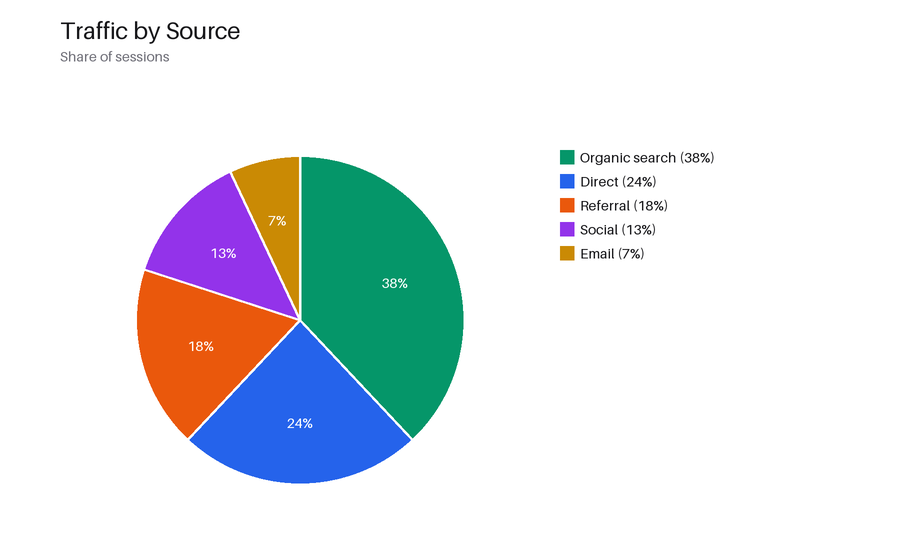
A five-slice pie chart of traffic sources with percentage labels and a legend — a real-world fixture for chart-recognition, segmentation, and OCR of embedded text.
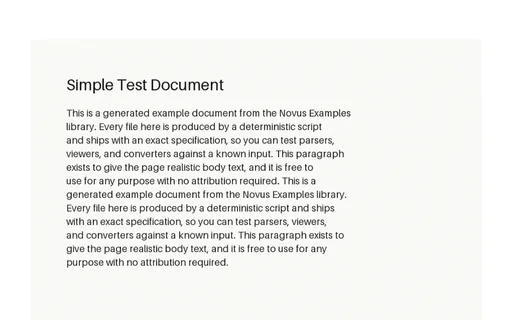
An image-only PDF containing a rasterised 'scan' of the simple document, with no text layer. Paired with the text version so you can score OCR output against a known ground truth.
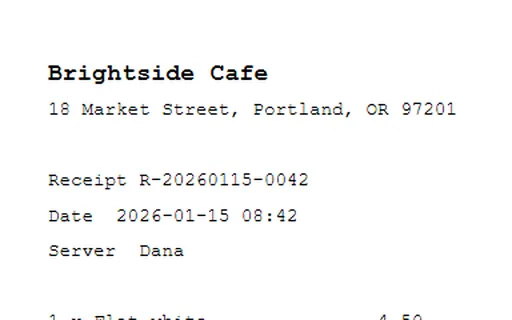
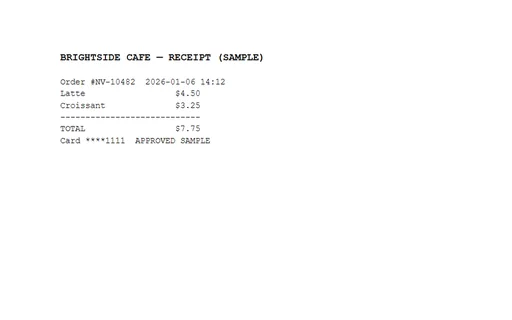
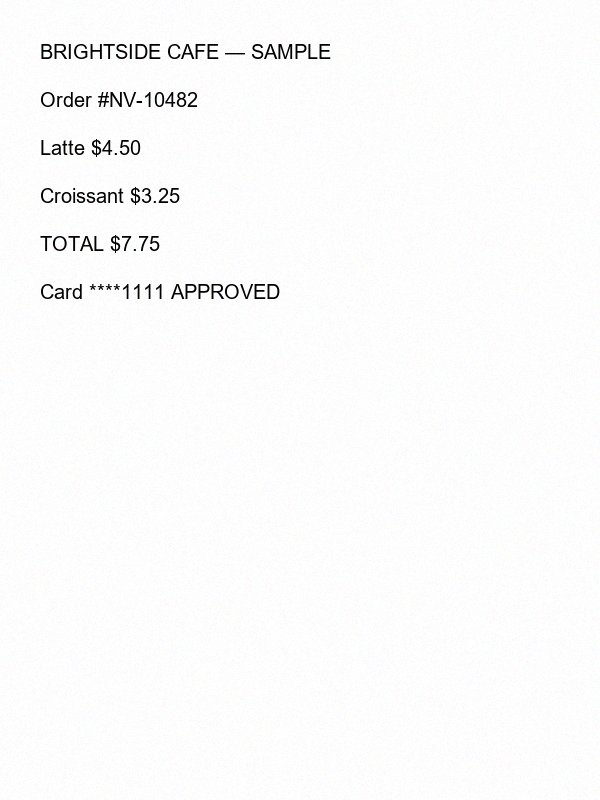
A realistic café receipt as a searchable PDF with a real text layer — the OCR ground truth paired with an image-only scanned twin, so you can score OCR output against known text.
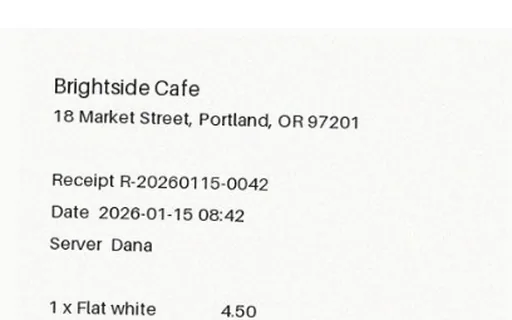
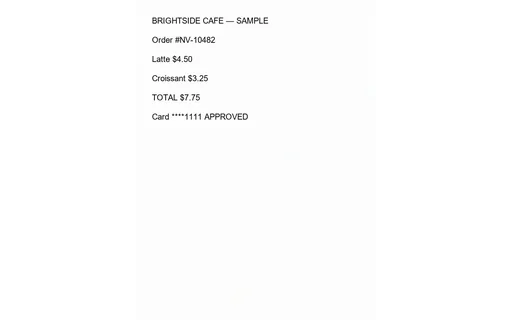
The same café receipt as an image-only 'scan' — no text layer, with a slight rotation and grain so it reads like a photographed receipt. Paired with the searchable version as OCR ground truth.
We use Google Analytics. It sets no analytics cookies until you allow the Analytics category below. See our cookie policy.