
Line Chart (PNG)
A two-series line chart (desktop vs. mobile visitors) with markers, a legend, and gridlines — for testing chart parsing, trend extraction, and image pipelines against a known plot.
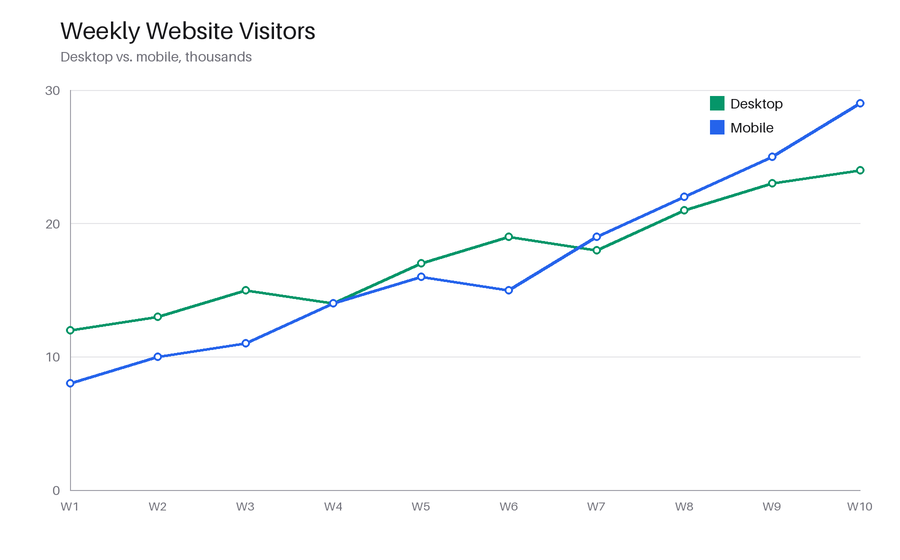
Specifications
- Chart Type
- line
- Series
- 2
- Points
- 10
- Legend
- true
- Size
- 900x560
What is a .png file?
PNG (Portable Network Graphics) is a raster image format using lossless DEFLATE compression. It supports full 8- or 16-bit-per-channel truecolor, palette, and greyscale modes with an optional alpha channel, but no animation. It is the standard choice for screenshots, logos, and graphics with sharp edges or transparency.
How to use this file
Use an example PNG to test image decoders, alpha-compositing, thumbnail generators, and format converters, or to verify that a pipeline preserves transparency and color depth on round-trip.
How to use this file for testing
“Line Chart (PNG)” is a deterministic Novus Examples fixture for Chart recognition, OCR testing, Thumbnail generation. Bar, line, pie, and scatter charts rendered as images with labelled axes, legends, and known values — for testing chart-extraction and chart-to-data tools, vision models, and OCR of embedded text.
Documented properties for this file: PNG · 43,642 bytes. Compare results against paired or grouped companions on this page when present (clean↔damaged, searchable↔scanned, or format twins) so scores stay reproducible across runs.
Download the file once, keep the path stable in CI or local scripts, and treat the spec table as the contract: dimensions, seeds, field lists, and roles are intentional. Corrupt or invalid samples are labelled as such — expect parsers to fail loudly rather than silently accept them.
For image AI or enhancement tools, run the model or filter on this file and diff against the clean or ground-truth companion in the same group when available. Keep seeds and documented damage parameters in your evaluation notes so regressions are attributable.
Code examples
<img src="line-chart.png" alt="Example image" width="640" loading="lazy">Related files
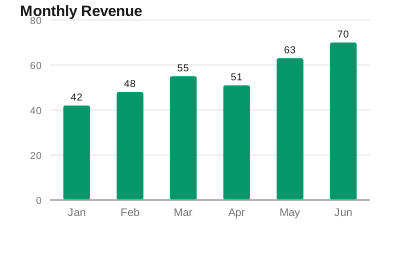
- svgBar Chart (SVG)A bar chart drawn as vector SVG — axis, gridlines, labelled bars — the scalable counterpart to the raster chart images, for testing SVG chart rendering and vector conversion.
- vcfBusiness Card — vCard (.vcf)The vCard (.vcf) ground truth for the business-card image — the same name, title, company, email, phone, and address in structured form. The positive reference for testing OCR-to-contact extraction.

- pngBusiness Card (OCR fixture)A rendered business card with a name, title, company, email, phone, and address — paired with a matching vCard so you can measure OCR and contact-extraction accuracy against a known ground truth.

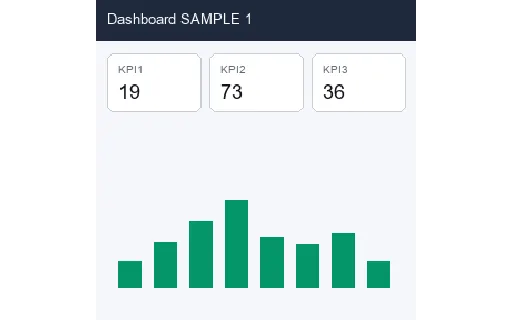
- pngDashboard Mock 01 (288px)Synthetic dashboard mock (KPI cards + bar chart) — SAMPLE UI for layout / chart vision models. Not a real product.
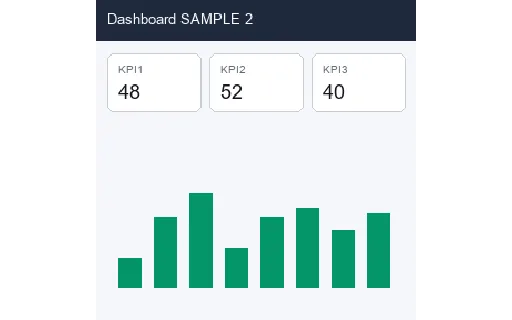
- pngDashboard Mock 02 (288px)Synthetic dashboard mock (KPI cards + bar chart) — SAMPLE UI for layout / chart vision models. Not a real product.
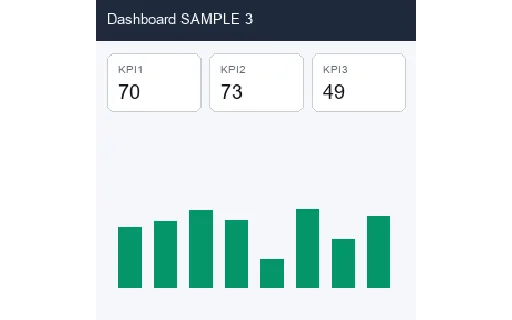
- pngDashboard Mock 03 (288px)Synthetic dashboard mock (KPI cards + bar chart) — SAMPLE UI for layout / chart vision models. Not a real product.
Generated by generation/images_charts.py. Free for any use, no attribution required — license.