
Resolution — 16×16 (16px thumbnail)
A fruit still life rendered at 16×16 (16px thumbnail) with a faint registration grid — part of a ladder from 16px to 4K for testing scaling, thumbnail generation, and responsive layout on recognisable content.
A resolution ladder and varied aspect ratios for exercising thumbnail and preview generators.
A fruit still life rendered at 16×16 (16px thumbnail) with a faint registration grid — part of a ladder from 16px to 4K for testing scaling, thumbnail generation, and responsive layout on recognisable content.
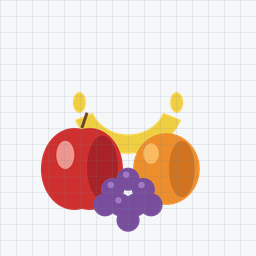
A fruit still life rendered at 256×256 (256px) with a faint registration grid — part of a ladder from 16px to 4K for testing scaling, thumbnail generation, and responsive layout on recognisable content.
A fruit still life rendered at 1920×1080 (1080p 16:9) with a faint registration grid — part of a ladder from 16px to 4K for testing scaling, thumbnail generation, and responsive layout on recognisable content.
A fruit still life rendered at 2560×1440 (1440p 16:9) with a faint registration grid — part of a ladder from 16px to 4K for testing scaling, thumbnail generation, and responsive layout on recognisable content.
A fruit still life rendered at 3840×2160 (4K 16:9) with a faint registration grid — part of a ladder from 16px to 4K for testing scaling, thumbnail generation, and responsive layout on recognisable content.
A fruit still life rendered at 1080×1920 (vertical 9:16) with a faint registration grid — part of a ladder from 16px to 4K for testing scaling, thumbnail generation, and responsive layout on recognisable content.
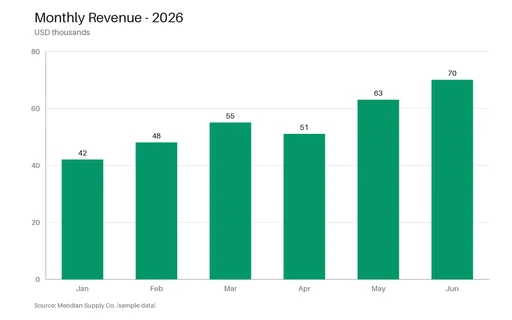
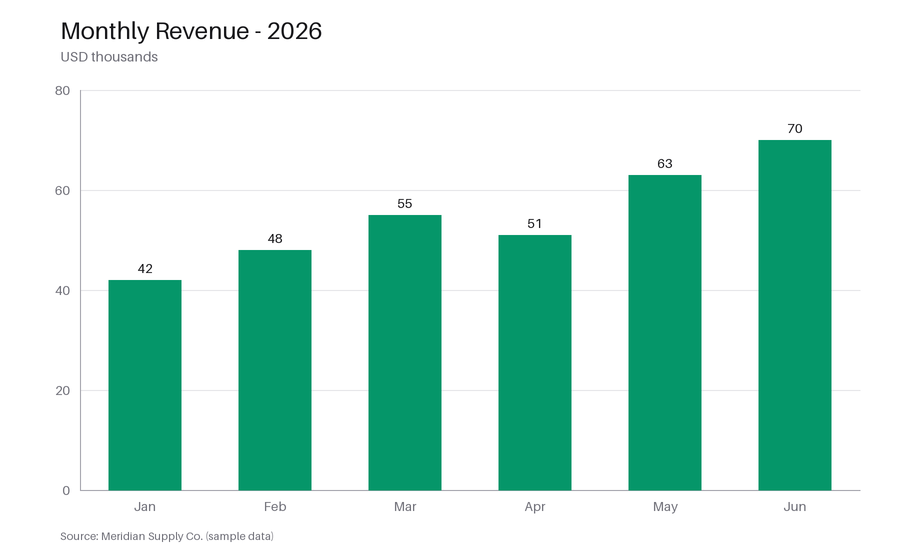
A clean bar chart of monthly revenue with axis labels, gridlines, and value labels — a real-world fixture for testing chart-extraction and OCR tools, vision models, and thumbnail rendering.
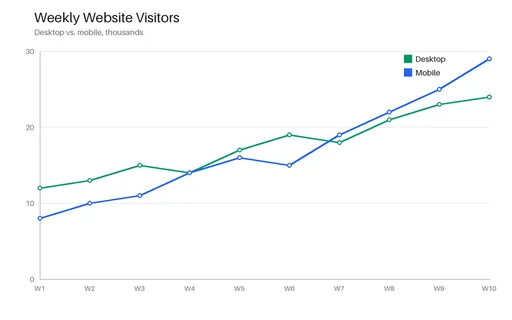
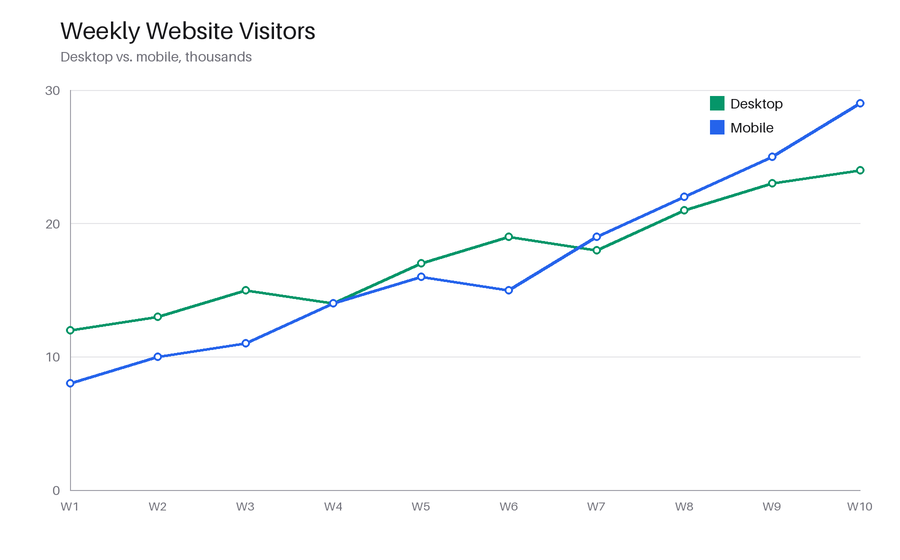
A two-series line chart (desktop vs. mobile visitors) with markers, a legend, and gridlines — for testing chart parsing, trend extraction, and image pipelines against a known plot.
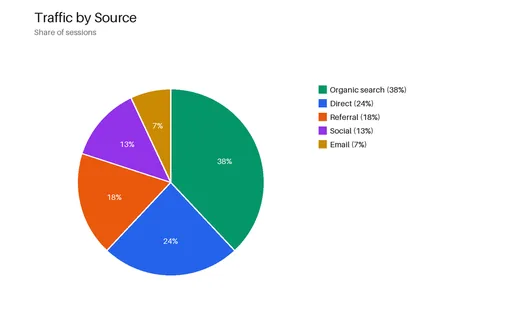
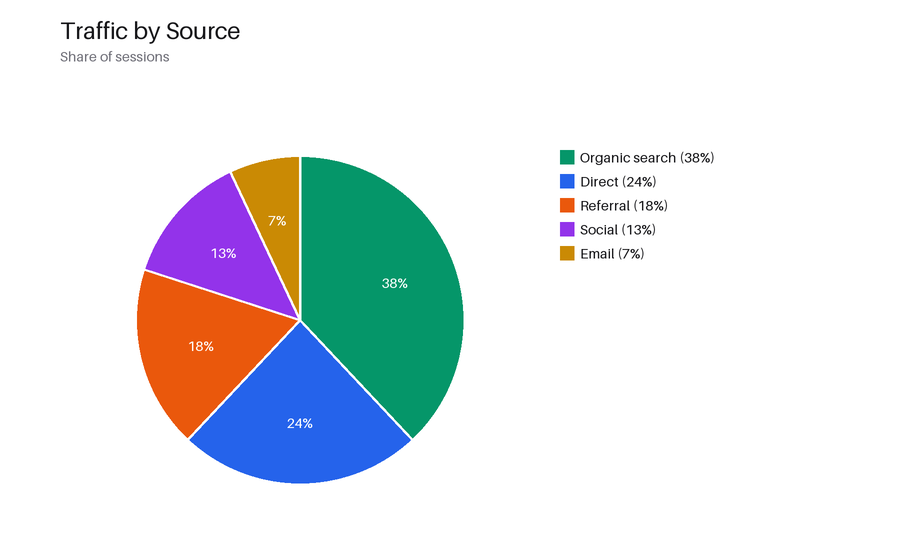
A five-slice pie chart of traffic sources with percentage labels and a legend — a real-world fixture for chart-recognition, segmentation, and OCR of embedded text.
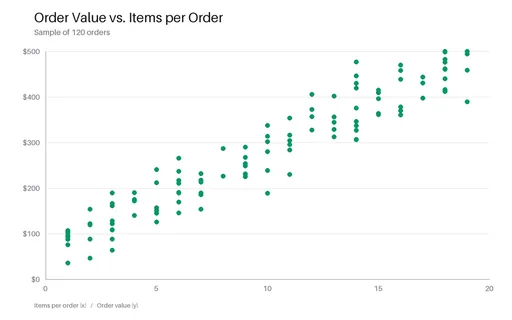
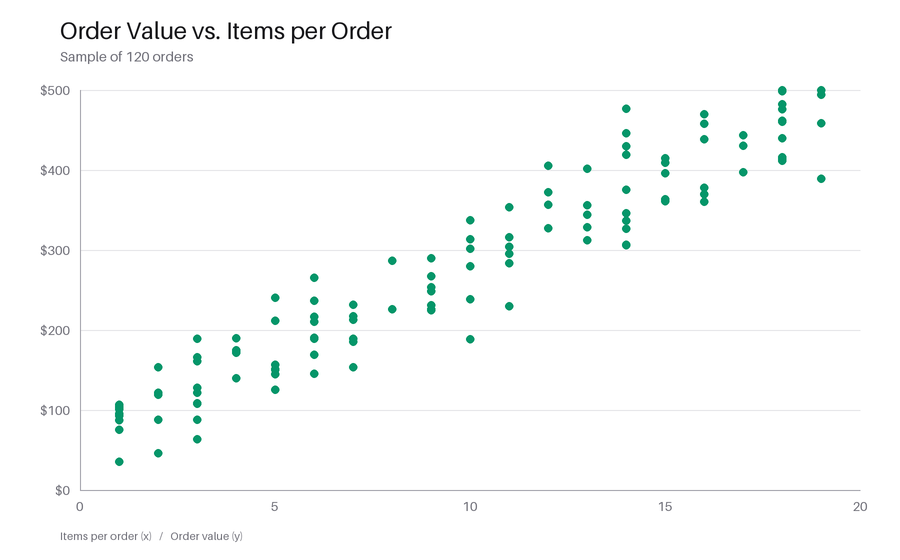
A scatter plot of 120 seeded points (order value versus items per order) showing a positive correlation, with labelled axes — for testing point-cloud extraction and chart parsing.
A generic sample brand logo as scalable vector graphics — a gradient mark plus a wordmark — for testing SVG rendering, rasterisation, and vector-to-raster conversion. Opens in the in-browser editor.
A flat vector landscape — gradient sky, sun, layered hills, and trees built from bezier paths — a richer SVG for testing gradient and path rendering, thumbnailing, and vector conversion.
We use Google Analytics. It sets no analytics cookies until you allow the Analytics category below. See our cookie policy.