
Testing Point-Cloud Reconstruction and Cleanup
Score a point-cloud denoiser or reconstruction tool against a clean, dense ground-truth scan, with Chamfer distance and normal consistency.
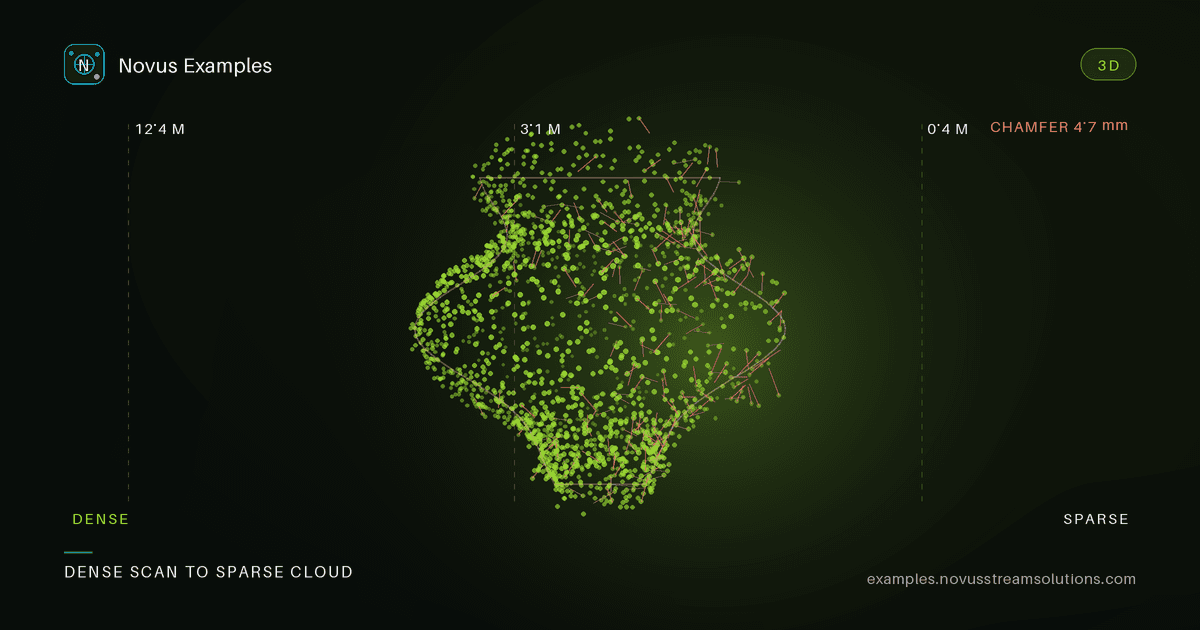
A point cloud from photogrammetry or a depth sensor is never clean: points are sparse where coverage was thin, and every point carries positional noise. Reconstruction and cleanup tools promise to recover the underlying surface. To test them you need the messy scan and the clean surface it should approximate. Otherwise "denoised" just means "different."
Each case in the point-cloud set ships a dense, noise-free cloud sampled on a known surface and a sparse, noisy scan of that same surface. The dense clean cloud is the reconstruction target; the sparse noisy cloud (700 points, documented noise sigma) is a realistic input. Run your denoiser or surface reconstructor on the noisy input and score the result against the clean target.
- Chamfer distance: for each point in one cloud, distance to the nearest point in the other, averaged both ways. The standard "how far apart are these two clouds" number.
- Point-to-plane / point-to-surface distance: if your tool outputs a mesh, sample it and measure distance to the clean reference. This is fairer to reconstruction than raw point Chamfer.
- Normal consistency: estimate normals on the result and compare orientation with the reference. Denoisers that over-smooth flatten curvature; a normal check catches it.
- Coverage / completeness: did the tool hallucinate points into empty space, or leave gaps? Report precision (are output points near the surface?) and recall (is the surface covered?) separately.
Chamfer is the standard metric here and it is easy to misuse. Three properties to design around:
- It is not scale-free. The raw number depends on the size of your model, so a threshold tuned on one shape is meaningless on another. Normalise by the bounding-box diagonal before comparing anything.
- Squared and unsquared variants differ a lot. Mean squared distance punishes outliers heavily; mean absolute distance barely notices them. Papers and libraries disagree about which one "Chamfer" means, so state which you use and never compare a number from one convention against the other.
- Averaging hides the failures you care about. A cloud with excellent coverage and twenty points floating in empty space averages out to a fine score. Report a percentile (the 95th, say) alongside the mean, and the outliers become visible.
Point count matters too: the metric is sensitive to how many points each cloud has, so a tool that outputs ten times as many points is not directly comparable to one that outputs few. Resample both sides to a fixed count before scoring, or report density alongside the distance.
The failure mode to hunt for is a tool that lowers Chamfer distance by collapsing points toward a smooth average, great for a sphere, disastrous for anything with features. Keep more than one shape in your suite and watch normal consistency alongside Chamfer: a real improvement moves points onto the surface and keeps the surface's shape.
The sparse-noisy input combines two degradations, and tools handle them very differently, so it is worth knowing which one you are actually testing. Noise moves points off the true surface; sparsity leaves regions with no points at all. A smoothing filter helps with the first and does nothing for the second, while an upsampler or surface reconstructor addresses the second and can amplify the first.
Read the two apart in your results:
- Precision (are the output points near the surface?) tracks how well noise was handled.
- Recall (is the surface covered?) tracks how well sparsity was handled.
A tool that improves one while degrading the other has not improved anything. It has traded, and an averaged Chamfer score will hide that completely. This is the main reason to report both numbers separately rather than a single distance.
The dense reference and the noisy scan are generated deterministically with a documented seed, so the "noise" is identical on every run. That makes Chamfer distance comparable across tool versions and CI runs, and a regression reproduces on the exact same scan.
Start with the point-cloud set, or the related photogrammetry fixtures. Free to use, no attribution required.
Continue this workflow
Was this article helpful?
Found an error? Send a correction.