
Spectrometer Absorbance With Expanded Uncertainty (.csv)
A synthetic absorbance scan from 400 to 630 nm with a Gaussian band at 520 nm, carrying its expanded uncertainty at k=2 in a dedicated column and a per-row quality flag. The unit and the coverage factor live in the column names, which is the convention most instrument exports actually use.
wavelength_nm,absorbance_AU,u_absorbance_AU_k2,blank_corrected,instrument_id,flag
400,0.02003,0.00424,true,NX-SPEC-SYNTH-01,ok
410,0.02018,0.00424,true,NX-SPEC-SYNTH-01,ok
420,0.02083,0.00425,true,NX-SPEC-SYNTH-01,ok
430,0.02338,0.00428,true,NX-SPEC-SYNTH-01,ok
440,0.03187,0.00438,true,NX-SPEC-SYNTH-01,ok
450,0.05600,0.00467,true,NX-SPEC-SYNTH-01,ok
460,0.11417,0.00537,true,NX-SPEC-SYNTH-01,ok
470,0.23246,0.00679,true,NX-SPEC-SYNTH-01,ok
480,0.43341,0.00920,true,NX-SPEC-SYNTH-01,ok
490,0.71380,0.01257,true,NX-SPEC-SYNTH-01,ok
500,1.02426,0.01629,true,NX-SPEC-SYNTH-01,ok
510,1.27375,0.01928,true,NX-SPEC-SYNTH-01,ok
520,1.37000,0.02044,true,NX-SPEC-SYNTH-01,near_saturation
530,1.27375,0.01928,true,NX-SPEC-SYNTH-01,ok
540,1.02426,0.01629,true,NX-SPEC-SYNTH-01,ok
550,0.71380,0.01257,true,NX-SPEC-SYNTH-01,ok
560,0.43341,0.00920,true,NX-SPEC-SYNTH-01,ok
570,0.23246,0.00679,true,NX-SPEC-SYNTH-01,ok
580,0.11417,0.00537,true,NX-SPEC-SYNTH-01,ok
590,0.05600,0.00467,true,NX-SPEC-SYNTH-01,ok
600,0.03187,0.00438,true,NX-SPEC-SYNTH-01,ok
610,0.02338,0.00428,true,NX-SPEC-SYNTH-01,ok
620,0.02083,0.00425,true,NX-SPEC-SYNTH-01,ok
630,0.02018,0.00424,true,NX-SPEC-SYNTH-01,ok
Specifications
- Rows
- 24
- Columns
- 6
- X Unit
- nm
- Y Unit
- AU (absorbance units)
- Uncertainty Column
- u_absorbance_AU_k2
- Coverage Factor
- 2
- Peak Wavelength Nm
- 520
- Synthetic
- true
Testing contract
Expected to pass- Scenario
- Ingest the file, parse the unit and coverage factor out of the column names, and locate the band maximum with its uncertainty.
- Expected result
- The maximum absorbance is 1.37 AU at 520 nm with an expanded uncertainty of 0.02044 AU, and that single row above 1.3 AU is the only one carrying the near_saturation flag.
What is a .csv file?
CSV (Comma-Separated Values) is a plain-text tabular format where rows are lines and fields are separated by commas, with quoting rules for values that contain delimiters, quotes, or newlines. It has no formal type system and depends on encoding and dialect conventions. It is the most portable format for tabular data exchange.
How to use this file
Use an example CSV to test parsers against quoting and embedded-delimiter edge cases, header handling, encoding detection, and import pipelines into databases or spreadsheets.
How to use this file for testing
“Spectrometer Absorbance With Expanded Uncertainty (.csv)” is a deterministic Novus Examples fixture for Scientific data, CSV parsing, Editor testing. Citation catalogs (BibTeX, RIS), chemistry structures (MDL Molfile, PDB), and gridded binary data (NetCDF, FITS) — for testing reference managers, molecule viewers, and scientific-data loaders.
Documented properties for this file: 24 rows · 6 columns. Compare results against paired or grouped companions on this page when present (clean↔damaged, searchable↔scanned, or format twins) so scores stay reproducible across runs.
Download the file once, keep the path stable in CI or local scripts, and treat the spec table as the contract: dimensions, seeds, field lists, and roles are intentional. Corrupt or invalid samples are labelled as such — expect parsers to fail loudly rather than silently accept them.
Scientific fixtures are small, valid, and fully synthetic — no real organism, patient, sample, or observation. Point your parser or loader at the file and check it reads the documented records, variables, or headers; binary formats ship a readable twin or metadata listing for comparison.
Code examples
import pandas as pd

df = pd.read_csv("spectrometer-absorbance.csv")
print(df.head())
print(df.dtypes)
Related files
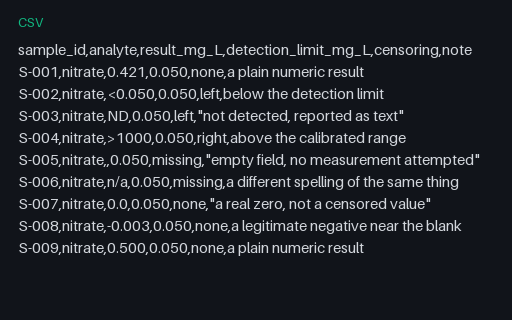
- csvCensored Values and Detection Limits — Non-Numeric Results (.csv)Nine laboratory results where only four are plain numbers: two are below the detection limit, one is above range, two are missing in different spellings, and one is a legitimate small negative near the blank. Coercing the censored strings to numbers or to NaN both bias the summary, and the file distinguishes every case explicitly.
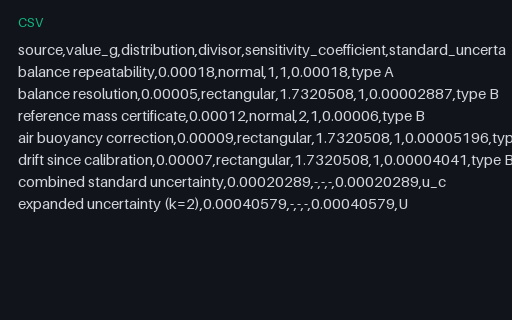
- csvGUM-Style Uncertainty Budget — Sources Combined in Quadrature (.csv)A five-source uncertainty budget laid out the way the GUM prescribes: each source with its distribution, its divisor, its sensitivity coefficient and its contribution, then the combined and expanded values. Rectangular sources are divided by the square root of three, which is the step budget spreadsheets most often get wrong.
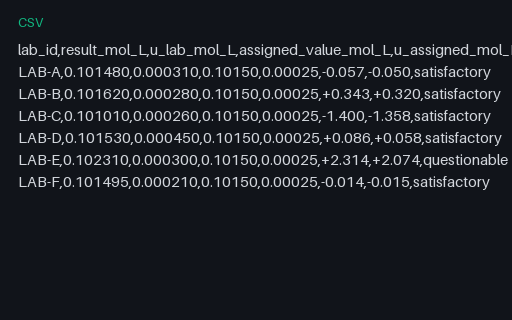
- csvInterlaboratory Comparison — z-Scores and En Numbers (.csv)Six fictional laboratories reporting the same measurand, scored both by z-score against a fixed sigma and by En number against each lab's own claimed uncertainty. The two statistics disagree about which labs are acceptable, which is the point: En rewards an honest uncertainty claim and z does not.
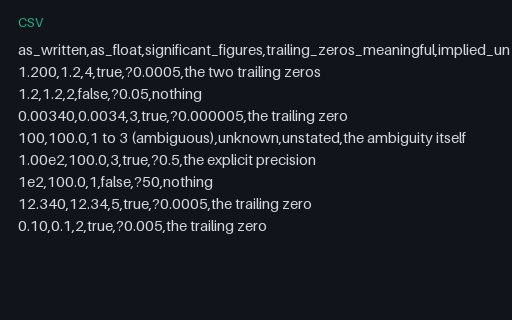
- csvSignificant Figures Lost to Float Parsing (.csv)Eight written measurements where the trailing zeros carry the precision of the measurement, alongside what a float parse leaves behind. Parsing 1.200 to the double 1.2 is not a rounding error, it is the loss of the claim that the value is known to four figures.
- csvTitration Replicates — Mean, SD, SEM and RSD (.csv)Four batches of five replicate titrations with the mean, sample standard deviation, standard error and relative standard deviation computed for each. The standard deviation uses the n-1 denominator, which is stated explicitly because a population-denominator implementation disagrees on every row.
- csvBinary versus Decimal Arithmetic — Where Floats Disagree (.csv)Eight arithmetic expressions where binary floating point and exact decimal disagree, with both answers and the signed error side by side. Adding one cent a hundred times does not give one, and this file says by exactly how much.
Generated by generation/scientific.py. Free for any use, no attribution required — license.