
Observability Fixtures for Log and Trace Parsers
Clock skew across hosts, timestamps out of order, a stack trace spanning twelve lines, and NaN in a Prometheus gauge. The telemetry shapes that break ingest.
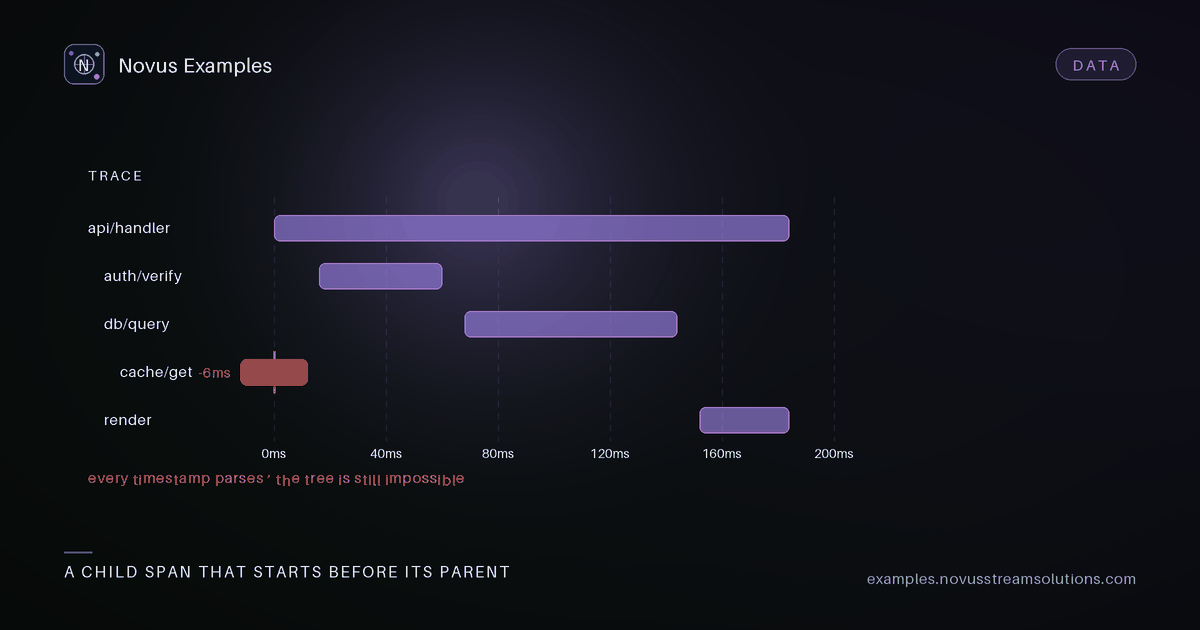
Not about facts, about time. Two hosts whose clocks differ by a few seconds will produce a trace where a child span starts before its parent, and a log pipeline fed by several producers will see timestamps go backwards. Both are normal. Code that assumes otherwise produces negative durations, dropped events and dashboards that are quietly wrong.
The observability catalogue is 120 fixtures covering traces, metrics, logs, profiles and alerting config.
Three log fixtures exist for exactly this:
json-lines-out-of-order-timestamps- events arriving late, which every real pipeline sees.json-lines-clock-skew-across-hosts- the same logical sequence recorded by hosts whose clocks disagree.json-lines-trace-correlated-logs- logs carrying trace and span ids, so they can be joined to a trace.
The questions these answer: does your ingest sort, or assume arrival order is event order? Does a negative computed duration get clamped, dropped, or stored as negative? Does a late event land in the right window or in the current one? None of those raise errors, and all of them change what a dashboard says.
otlp-json-trace-checkout, otlp-trace-proto3-json-encoding, jaeger-json-trace-checkout,
zipkin-v2-trace-checkout, and trace-span-table-csv-export.
The same checkout journey in OTLP JSON, OTLP's proto3-JSON encoding, Jaeger's format, Zipkin v2, and flattened to CSV. That makes them a conversion test set: a converter's output can be compared against a sibling representing the same truth.
The proto3-JSON encoding deserves its own mention. It is not ordinary JSON: 64-bit integers are strings, enums may appear as names or numbers, and field names are camelCase where the proto is snake_case. A parser written against hand-written OTLP JSON meets all three the first time it sees real exporter output.
prometheus-exposition-counters-gauges- the baseline.prometheus-exposition-histogramand-summary- the two aggregate types, which are frequently conflated. A histogram carries cumulative buckets; a summary carries precomputed quantiles that cannot be aggregated across instances. Averaging summary quantiles across three replicas is a common and completely invalid operation.prometheus-label-value-escaping- quotes, backslashes and newlines inside label values.prometheus-special-numeric-values-NaN,+Inf,-Inf, which are legal in the exposition format. A parser using a naive float conversion either throws or silently produces zero, and zero is much worse: a gauge that should read "no data" reads "nothing is happening".
json-lines-with-multiline-stack-traces.
JSON Lines promises one object per line, and a stack trace embedded in a message field contains newlines that must be escaped. Producers get this wrong constantly. The fixture lets you decide what your reader does with a line that is not valid JSON: skip and count, or abort the file. Both are defensible; silently skipping without counting is not, because the loss is invisible.
cpu-folded-stacks-before and cpu-folded-stacks-after are the same program profiled either side
of a change, which is the shape a flame-graph differ needs. allocation-folded-stacks-bytes
profiles bytes rather than time, wall-clock-folded-stacks-per-thread splits by thread, and
folded-stacks-deep-recursion is the one that breaks renderers: a stack deep enough that naive
recursive layout hits a limit.
prometheus-alerting-rules, prometheus-recording-rules, prometheus-scrape-configuration,
alertmanager-routing-configuration, and prometheus-alerting-rules-invalid.
The invalid one is the point. Alerting config is the code that tells you when everything else is broken, so a validator that accepts a malformed rule file is a silent single point of failure. Test that yours rejects it, and read the message it gives.
prometheus-special-numeric-values, because NaN becoming zero inverts a dashboard's meaning.json-lines-clock-skew-across-hosts, and check for negative durations.otlp-trace-proto3-json-encoding, if you parse OTLP at all.json-lines-with-multiline-stack-traces, and make sure skipped lines are counted.prometheus-alerting-rules-invalid, to confirm your validator is not a no-op.
Continue this workflow
Try the workflow
Documentation and troubleshooting
Was this article helpful?
Found an error? Send a correction.