
Tern Client Services — Operating chart PNG
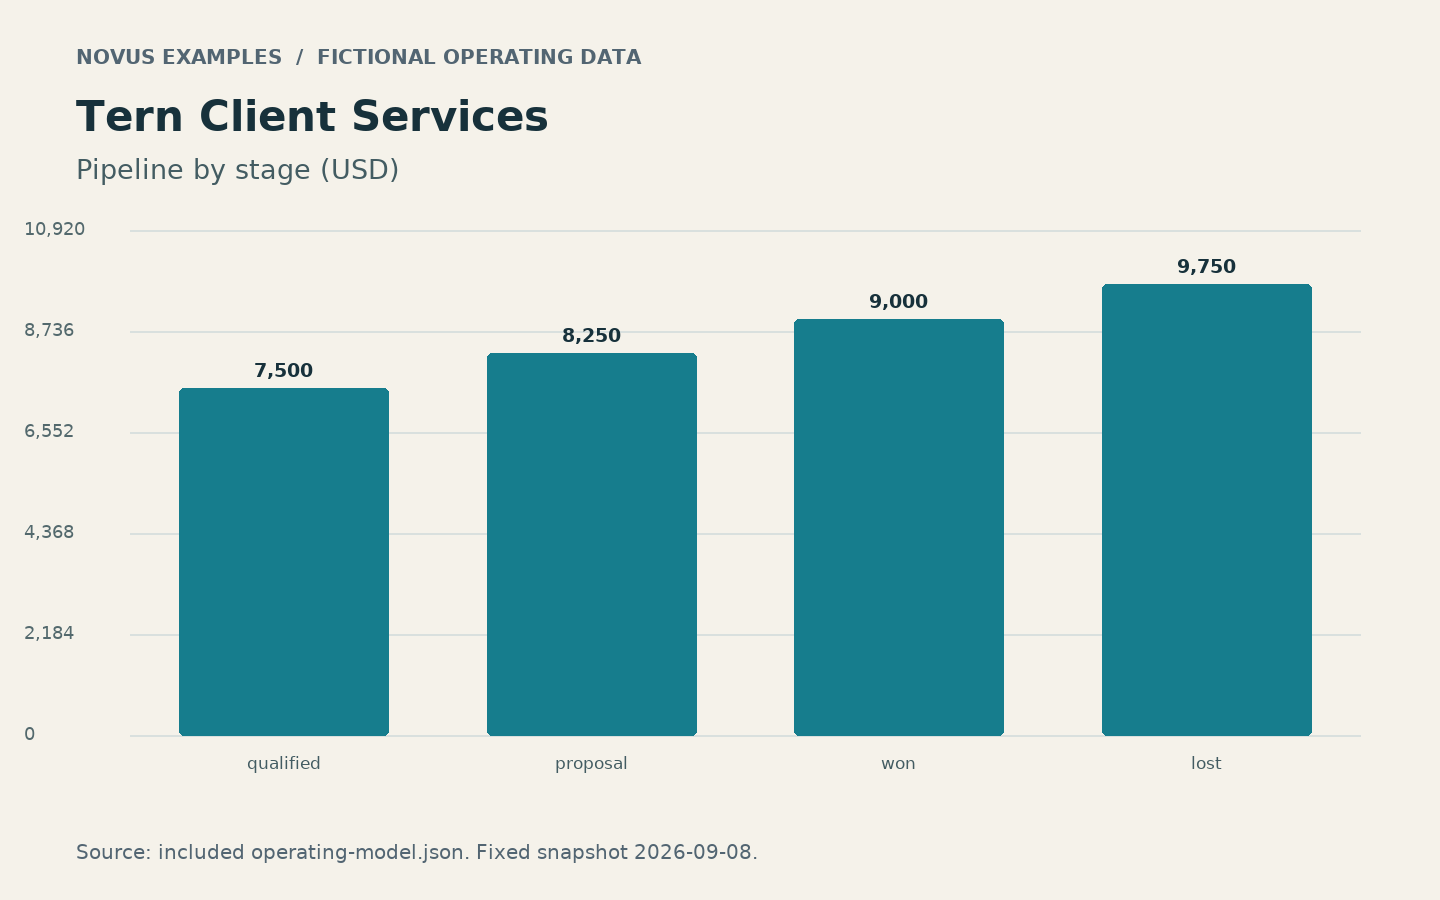
Operating chart PNG for Tern Client Services. A 1440 by 900 RGB chart with 4 labeled source-derived observations in USD.
Specifications
- Kit
- crm-services
- Industry
- professional-services
- Schema Version
- 1
- Synthetic
- true
- As Of
- 2026-09-08
- Width
- 1440
- Height
- 900
- Chart Points
- 4
Testing contract
Expected to pass- Scenario
- Use operating chart png in the Tern Client Services contacts, sales-pipeline, activities, leads, quotes, projects, timesheets, invoicing workflow.
- Expected result
- A 1440 by 900 RGB chart with 4 labeled source-derived observations in USD.
What is a .png file?
PNG (Portable Network Graphics) is a raster image format using lossless DEFLATE compression. It supports full 8- or 16-bit-per-channel truecolor, palette, and greyscale modes with an optional alpha channel, but no animation. It is the standard choice for screenshots, logos, and graphics with sharp edges or transparency.
How to use this file
Use an example PNG to test image decoders, alpha-compositing, thumbnail generators, and format converters, or to verify that a pipeline preserves transparency and color depth on round-trip.
How to use this file for testing
“Tern Client Services — Operating chart PNG” is a deterministic Novus Examples fixture for Data import. Realistic faker-generated datasets with documented schemas for testing import and ETL flows.
Documented properties for this file: 1440×900. Compare results against paired or grouped companions on this page when present (clean↔damaged, searchable↔scanned, or format twins) so scores stay reproducible across runs.
Download the file once, keep the path stable in CI or local scripts, and treat the spec table as the contract: dimensions, seeds, field lists, and roles are intentional. Corrupt or invalid samples are labelled as such, expect parsers to fail loudly rather than silently accept them.
For image AI or enhancement tools, run the model or filter on this file and diff against the clean or ground-truth companion in the same group when available. Keep seeds and documented damage parameters in your evaluation notes so regressions are attributable.
Code examples
<img src="chart.png" alt="Example image" width="640" loading="lazy">Related files
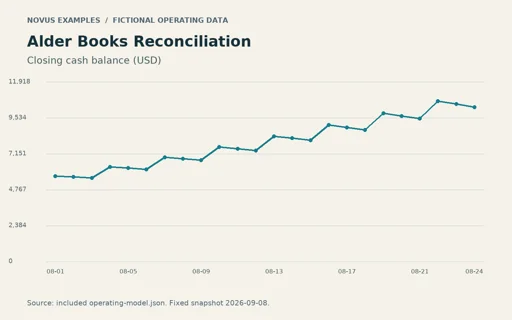
- pngAlder Books Reconciliation — Operating chart PNGOperating chart PNG for Alder Books Reconciliation. A 1440 by 900 RGB chart with 24 labeled source-derived observations in USD.
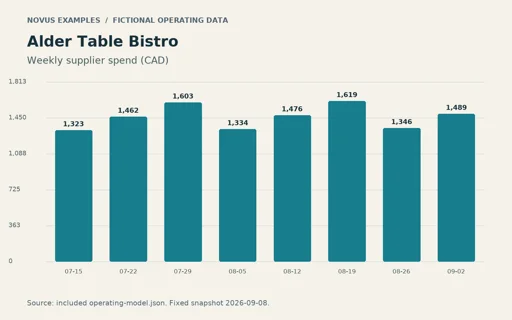
- pngAlder Table Bistro — Operating chart PNGOperating chart PNG for Alder Table Bistro. A 1440 by 900 RGB chart with 8 labeled source-derived observations in CAD.
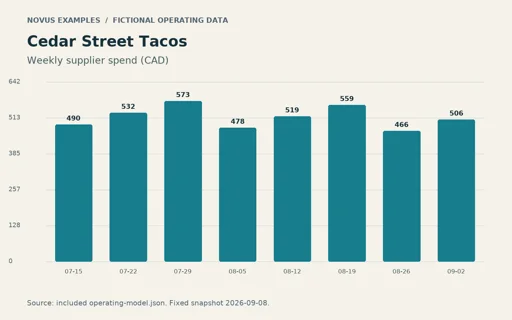
- pngCedar Street Tacos — Operating chart PNGOperating chart PNG for Cedar Street Tacos. A 1440 by 900 RGB chart with 8 labeled source-derived observations in CAD.
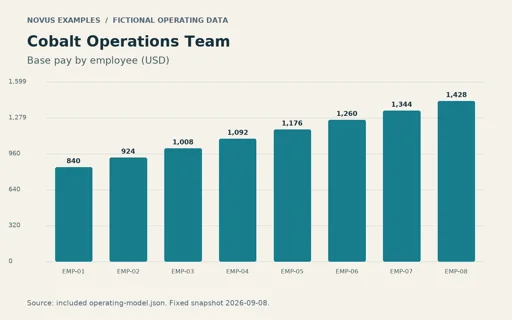
- pngCobalt Operations Team — Operating chart PNGOperating chart PNG for Cobalt Operations Team. A 1440 by 900 RGB chart with 8 labeled source-derived observations in USD.
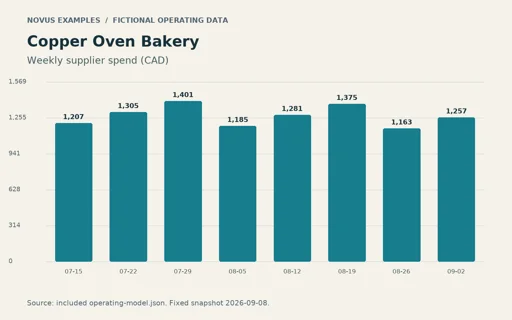
- pngCopper Oven Bakery — Operating chart PNGOperating chart PNG for Copper Oven Bakery. A 1440 by 900 RGB chart with 8 labeled source-derived observations in CAD.
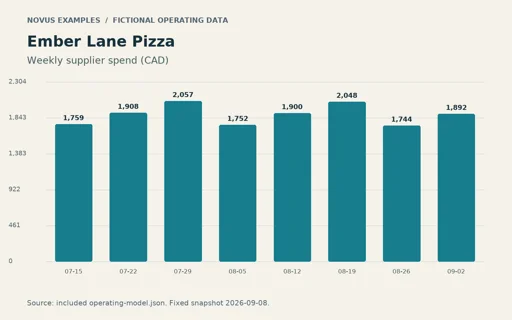
- pngEmber Lane Pizza — Operating chart PNGOperating chart PNG for Ember Lane Pizza. A 1440 by 900 RGB chart with 8 labeled source-derived observations in CAD.
Generated by generation/business_fixtures.py. Free for any use, no attribution required, license.