
XLSX with Embedded Charts
A workbook with a data table plus a native bar chart and a line chart bound to the cells — for testing whether spreadsheet parsers and XLSX-to-PDF converters preserve and render embedded charts.
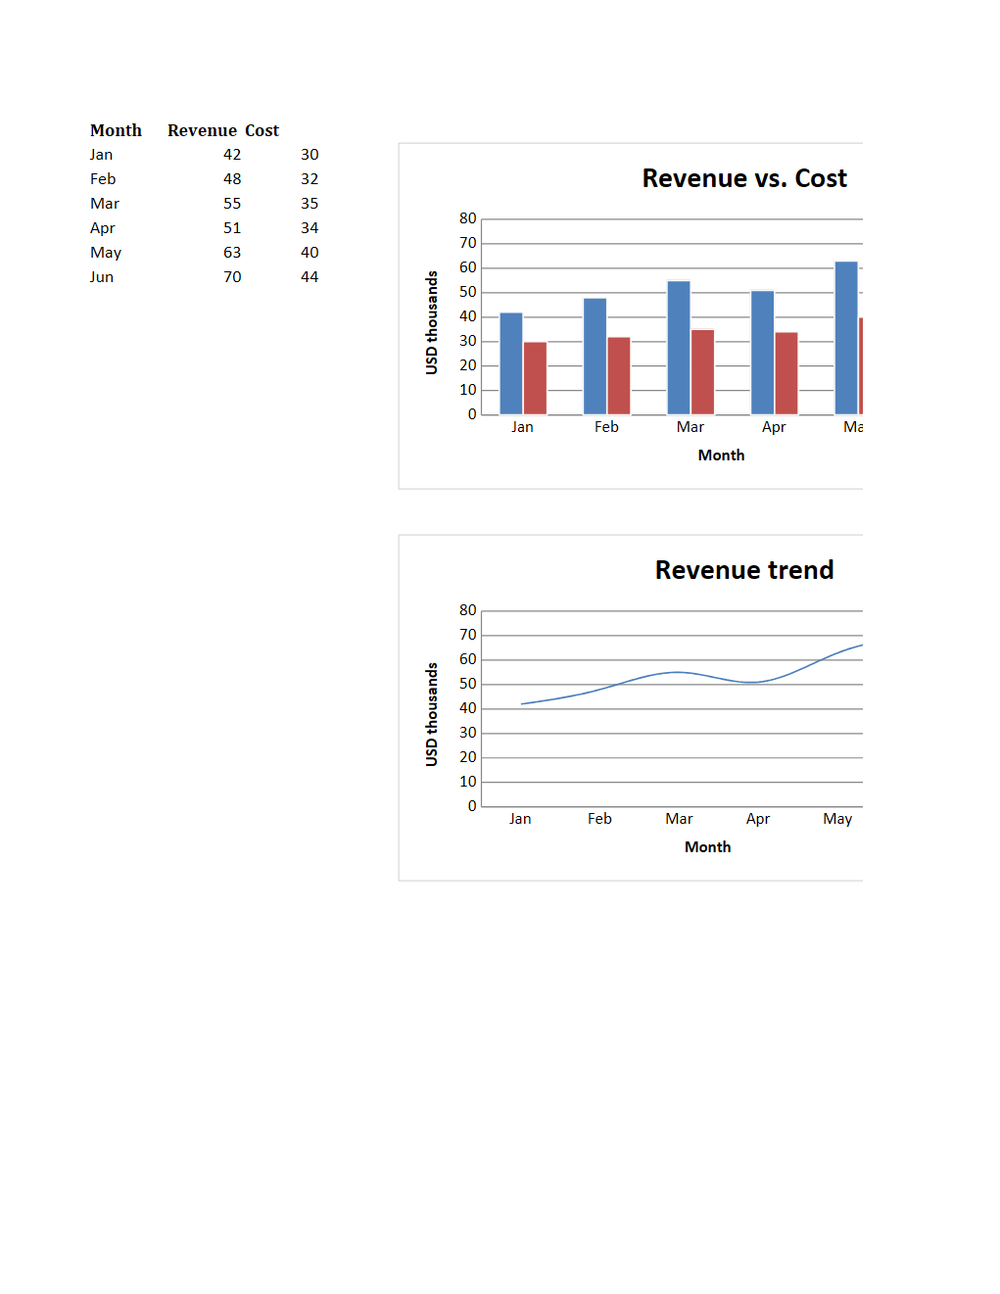
Rendered preview of the xlsx file (7.2 KB). Download above for the original.
Specifications
- Charts
- bar + line
- Series
- 2
- Data Rows
- 6
- Engine
- openpyxl
What is a .xlsx file?
XLSX is the default Microsoft Excel format, an Office Open XML spreadsheet stored as a ZIP archive containing worksheet XML, shared strings, styles, and formulas. It supports multiple sheets, cell formatting, charts, and calculated values. It is the standard for editable tabular workbooks.
How to use this file
Use an example XLSX to test spreadsheet parsing, formula and multi-sheet handling, shared-string extraction, and pipelines that read or generate Excel workbooks.
How to use this file for testing
“XLSX with Embedded Charts” is a deterministic Novus Examples fixture for Spreadsheet testing, Conversion testing. Multi-sheet workbooks with documented formulas and plain sheets for testing spreadsheet parsers and importers.
Documented properties for this file: XLSX · 7,363 bytes. Compare results against paired or grouped companions on this page when present (clean↔damaged, searchable↔scanned, or format twins) so scores stay reproducible across runs.
Download the file once, keep the path stable in CI or local scripts, and treat the spec table as the contract: dimensions, seeds, field lists, and roles are intentional. Corrupt or invalid samples are labelled as such — expect parsers to fail loudly rather than silently accept them.
Document fixtures list their internal structure (pages, fields, tracked changes, embedded objects) in the spec table. Test extractors, converters, and OCR against that known structure, and compare searchable↔scanned or format-twin companions when present.
Code examples
from openpyxl import load_workbook

wb = load_workbook("embedded-charts.xlsx")
ws = wb.active
print(ws.title, ws.max_row, ws.max_column)
Related files
- xlsxMulti-Sheet XLSX with FormulasA two-sheet workbook where a Summary sheet references a Data sheet with SUM and arithmetic formulas — for testing spreadsheet parsers, formula evaluation, and converters.
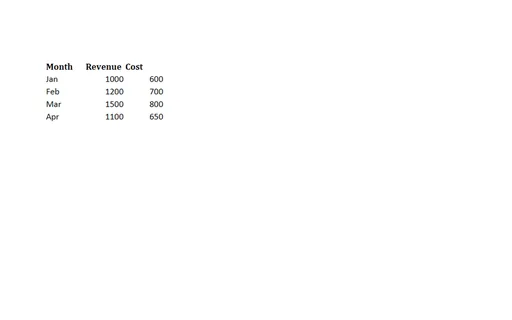
- odsODS — OpenDocument SpreadsheetAn OpenDocument Spreadsheet with the same tabular data as the plain XLSX and legacy XLS — a member of an XLSX↔ODS↔XLS conversion set for spreadsheet importers.
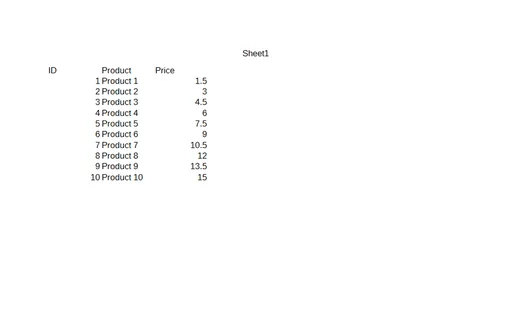
- xlsXLS — Legacy Excel WorkbookA legacy Excel 97–2003 (.xls / BIFF8) workbook holding the same tabular data as the plain XLSX and ODS — for testing legacy-format readers and XLS↔XLSX conversion.
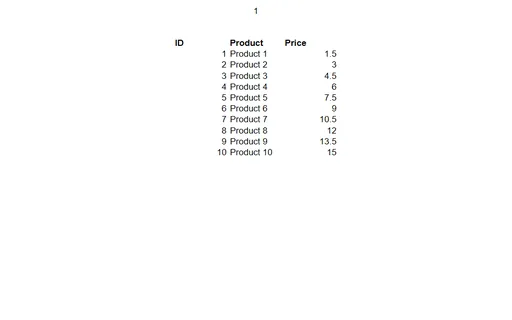
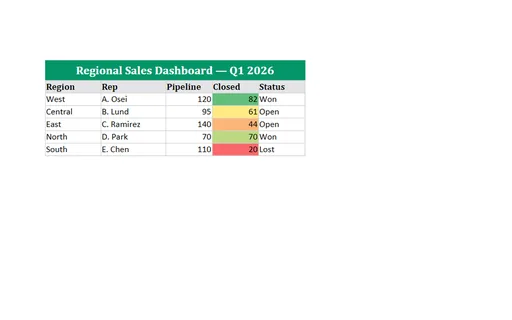
- xlsxXLSX with Merged Cells, Conditional Formatting & Data ValidationA dashboard sheet exercising the features importers miss: a merged title cell, a three-colour conditional-formatting scale, a data-validation dropdown, cell borders, and frozen panes.
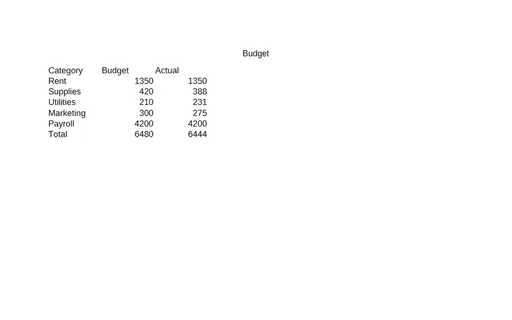
- odsBudget Template (ODS, with formulas)A budget template as OpenDocument Spreadsheet — budget-versus-actual rows with live SUM formulas for the totals. A usable planning template and a fixture for testing ODS formula parsing and recalculation.
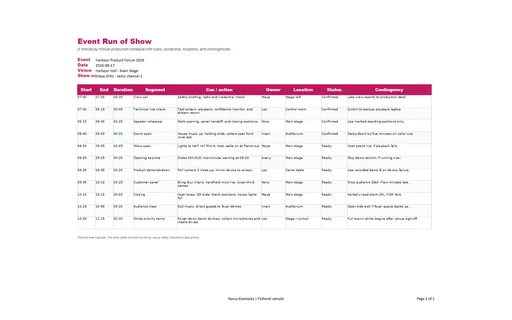
- xlsxEvent Run of Show (XLSX)A minute-by-minute production schedule with cues, ownership, locations, and contingencies. This Excel workbook adds filters, frozen headers, print settings, typed cells, and live formulas where the model defines them.
Generated by generation/docs_advanced.py. Free for any use, no attribution required — license.