
World Cities (40 rows, CSV)
A curated world-cities dataset — 40 major cities with country, latitude, longitude, and population. A realistic geospatial fixture for testing map plots, geocoding, and CSV→GeoJSON conversion. GeoJSON twin included.
name,country,latitude,longitude,population
Tokyo,JP,35.6762,139.6503,37400068
Delhi,IN,28.7041,77.1025,32941308
Shanghai,CN,31.2304,121.4737,29210808
São Paulo,BR,-23.5505,-46.6333,22620000
Mexico City,MX,19.4326,-99.1332,22085140
Cairo,EG,30.0444,31.2357,21750020
Mumbai,IN,19.076,72.8777,20961472
Beijing,CN,39.9042,116.4074,20896820
Dhaka,BD,23.8103,90.4125,22478116
Osaka,JP,34.6937,135.5023,19222665
New York,US,40.7128,-74.006,18804000
Karachi,PK,24.8607,67.0011,16459472
Buenos Aires,AR,-34.6037,-58.3816,15490000
Istanbul,TR,41.0082,28.9784,15519267
Kolkata,IN,22.5726,88.3639,14850000
Lagos,NG,6.5244,3.3792,15388000
Manila,PH,14.5995,120.9842,14406059
Rio de Janeiro,BR,-22.9068,-43.1729,13458000
Los Angeles,US,34.0522,-118.2437,12447000
Moscow,RU,55.7558,37.6173,12537954
Paris,FR,48.8566,2.3522,11017000
London,GB,51.5074,-0.1278,9648110
Lima,PE,-12.0464,-77.0428,11044607
Bangkok,TH,13.7563,100.5018,10722000
Seoul,KR,37.5665,126.978,9963452
Jakarta,ID,-6.2088,106.8456,10770487
Bogotá,CO,4.711,-74.0721,11167392
Chicago,US,41.8781,-87.6298,8865000
Toronto,CA,43.6532,-79.3832,6255000
Sydney,AU,-33.8688,151.2093,5312000
Berlin,DE,52.52,13.405,3677472
Madrid,ES,40.4168,-3.7038,3223334
Nairobi,KE,-1.2921,36.8219,4397073
Lisbon,PT,38.7223,-9.1393,544851
Dubai,AE,25.2048,55.2708,3331420
Singapore,SG,1.3521,103.8198,5453600
Johannesburg,ZA,-26.2041,28.0473,5635000
Stockholm,SE,59.3293,18.0686,975551
Vienna,AT,48.2082,16.3738,1897000
Amsterdam,NL,52.3676,4.9041,872680
Specifications
- Rows
- 40
- Schema
- name, country, latitude, longitude, population
- Note
- curated sample of major cities; coordinates are real
What is a .csv file?
CSV (Comma-Separated Values) is a plain-text tabular format where rows are lines and fields are separated by commas, with quoting rules for values that contain delimiters, quotes, or newlines. It has no formal type system and depends on encoding and dialect conventions. It is the most portable format for tabular data exchange.
How to use this file
Use an example CSV to test parsers against quoting and embedded-delimiter edge cases, header handling, encoding detection, and import pipelines into databases or spreadsheets.
How to use this file for testing
“World Cities (40 rows, CSV)” is a deterministic Novus Examples fixture for Geospatial, Data import, Conversion testing. GeoJSON, GPX, and KML files with points, lines, polygons, and tracks — for testing map tools, route parsers, and geo importers.
Documented properties for this file: 40 rows · schema: name, country, latitude, longitude, population. Compare results against paired or grouped companions on this page when present (clean↔damaged, searchable↔scanned, or format twins) so scores stay reproducible across runs.
Download the file once, keep the path stable in CI or local scripts, and treat the spec table as the contract: dimensions, seeds, field lists, and roles are intentional. Corrupt or invalid samples are labelled as such — expect parsers to fail loudly rather than silently accept them.
Data fixtures document their exact quirks — delimiters, encodings, null handling, schema, and row counts — in the spec table. Point your parser or importer at the file and assert it handles the documented edge cases; clean and deliberately-messy siblings make before/after diffs straightforward.
Code examples
import pandas as pd

df = pd.read_csv("world-cities.csv")
print(df.head())
print(df.dtypes)
Related files
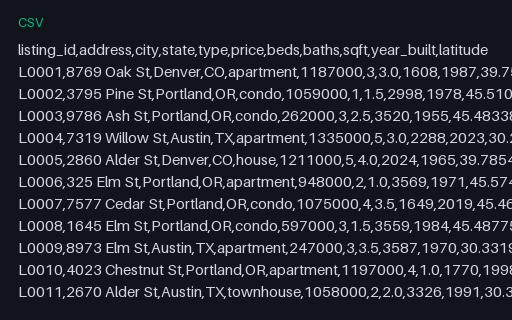
- csvReal-estate Listings (CSV, 30 rows)A property-listings dataset — 30 homes with address, type, price, beds/baths, size, year built, coordinates, and status. Synthetic data for testing listing importers, map plots, and price analytics.
- jsonReal-estate Listings (JSON, 30 records)The property listings as a JSON array — the format twin of the CSV, for import and mapping tests.

- gpkgGeoPackage — Aspatial Attributes Table (no geometry column)A GeoPackage holding an `attributes` table with no geometry at all — the standard's own answer to a lookup table you want to ship alongside your layers. Its gpkg_contents row has null bounds and a null SRS, which is what readers that assume every row is spatial trip over.
- gpkgGeoPackage — Three Feature Layers in One SQLite ContainerThe territory as an OGC GeoPackage: an ordinary SQLite database with the three required metadata tables and three feature layers whose geometry columns hold GeoPackage binary blobs. Unlike a shapefile it carries several geometry types, long column names and real typed columns in one file.
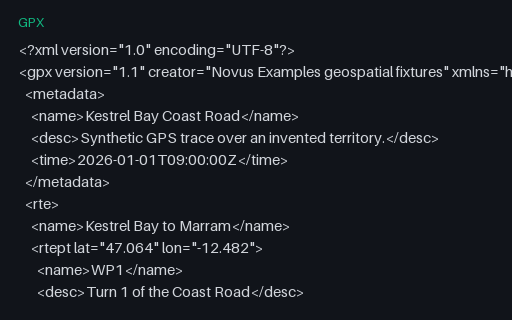
- gpxGPX — Route (rte) Rather Than a TrackA `rte` element: an ordered list of waypoints describing a planned route, with no timestamps because it has not been travelled yet. Many importers only look for `trk` and report this perfectly valid file as empty.
- gpxGPX — Standalone Waypoints OnlyFive `wpt` elements for the towns of the territory, with names, symbols and descriptions but no track or route. It is the GPX equivalent of a point layer, and the third of the three top-level GPX content types.
Generated by generation/data_graphs.py. Free for any use, no attribution required — license.